This page will house this report's training documents. Feel free to bookmark for quick and easy access.
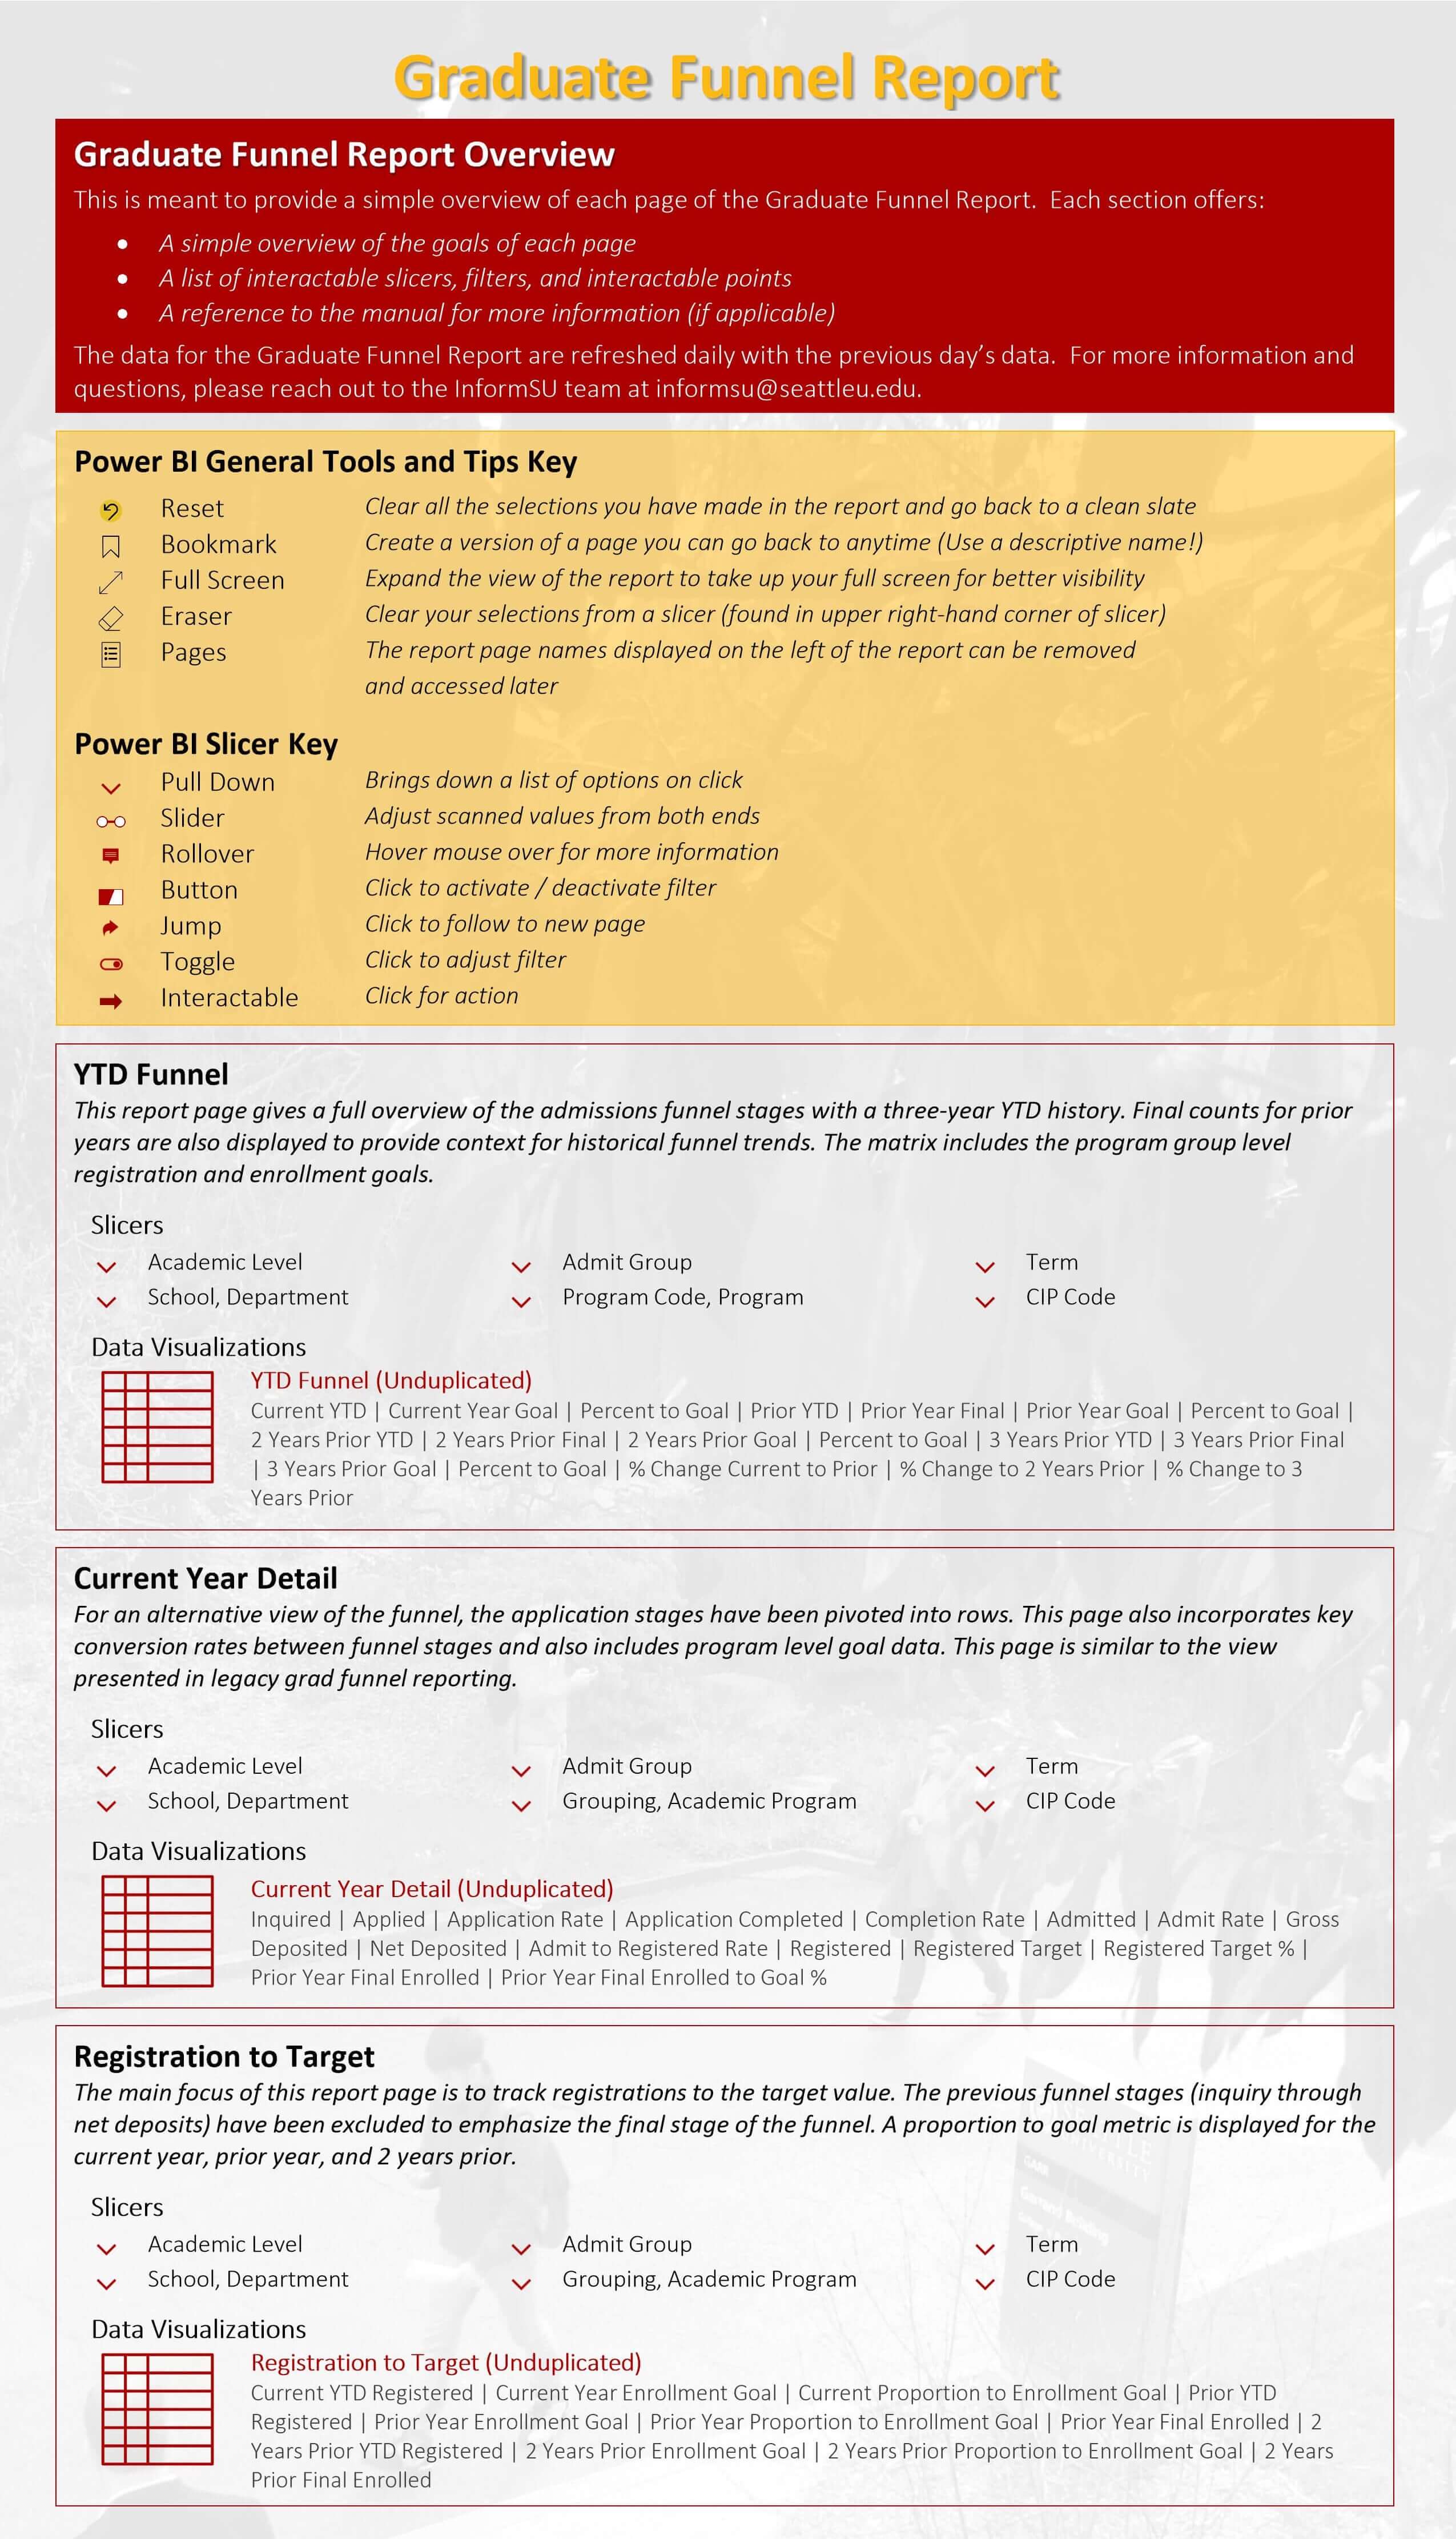
This report is focused on the population of students who have applied for graduate level academic programs. The year over year framework mirrors that of the general Admissions Funnel Report, meaning that you can view current funnel figures and compare them with prior YTD (year to date), two years prior YTD, and three years prior YTD along with final funnel counts for the prior three years. One of the main differences in this report, aside from the student population filter, is the integration of graduate program registration goals.
The YTD Funnel page includes the absolute goal value and percent to goal calculation for the full four year history displayed in the report. Users can select an academic level, admit group, school, department, program group, program, or CIP code to filter visuals in the report.
The Current Year Detail shows only the current funnel figures and prior year final values and displays the distinct student counts and conversion rates by school, department, program group, and academic program. This page resembles the legacy excel version of the Graduate Admissions Funnel report.
The final tab of this report is the Registration to Target matrix which shows a longitudinal view of registration and enrollment values for the current year, prior year, and two years prior. This page is intended to allow users to track their progress towards goal against the same period last year and two years prior.
For more information such as page notes, a list of page slicers, and page visualizations, expand the Infographic in the Training Documents below.
| Date | Release Version | Release Notes |
|---|---|---|
| 9/17/21 | 1.0 | Initial Release |

This training video gives an overview of the Graduate Funnel Report and its report pages.