Benchmarked Graduation and Retention Rates by Student Populations
To ensure the diverse population of Seattle University students is well-served, the university benchmarks retention and graduation rates for various student populations using data from the U.S. Department of Education provided through the Integrated Postsecondary Education Data System (IPEDS). The graphs below compare the fall-to-fall retention rates, four-year graduation rates, and six-year graduation rates of Seattle University entering first-year cohorts with a set of aspirational peer institutions, as well as with all private non-profit colleges and universities offering bachelor’s degrees, using the most recent ten years of data available through IPEDS. Benchmarked data is supplemented with Seattle University data that provides additional detail for specific populations of students not available through IPEDS.
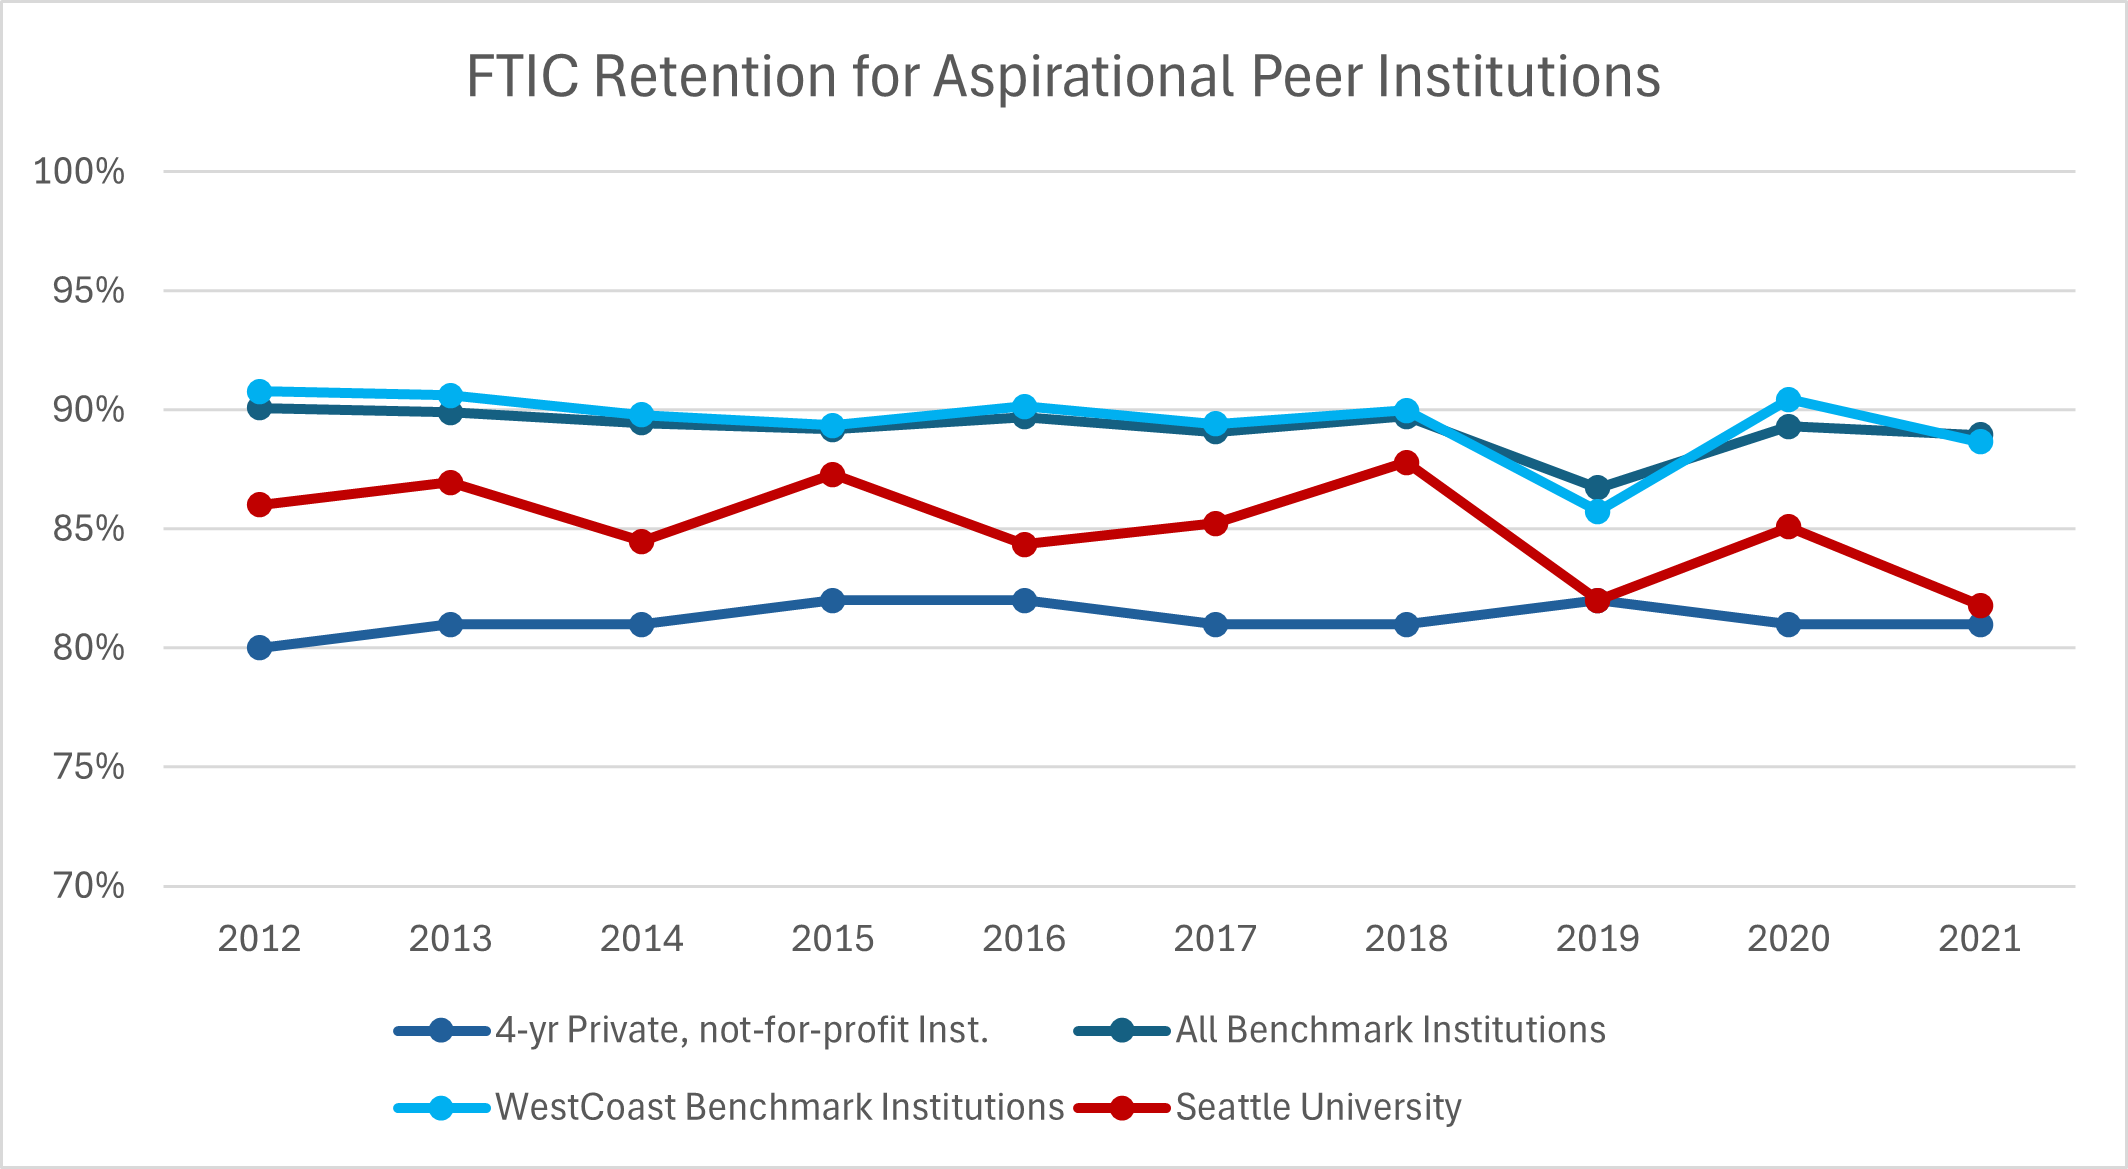
FTIC Retention for Aspirational Peer Institutions
Peer institutions provide benchmark comparisons that are essential to Seattle University's assessment strategies and are used as one component in determining the relative health, growth, and progress of our institution toward our strategic goals. These peer institutions are similar to Seattle University across multiple dimensions (e.g., mission, selectivity, Carnegie classification, size of student population, endowments) and taken together, this peer group provides an aspirational “stretch” as we measure our institutional progress.
| Year | 4-yr Private, not-for-profit Inst. | All Benchmark Institutions | WestCoast Benchmark Institutions | Seattle University |
|---|---|---|---|---|
| 2012 | 80% | 90% | 91% | 86% |
| 2013 | 81% | 90% | 91% | 87% |
| 2014 | 81% | 89% | 90% | 84% |
| 2015 | 82% | 89% | 89% | 87% |
| 2016 | 82% | 90% | 90% | 84% |
| 2017 | 81% | 89% | 89% | 85% |
| 2018 | 81% | 90% | 90% | 88% |
| 2019 | 82% | 87% | 86% | 82% |
| 2020 | 81% | 89% | 90% | 85% |
| 2021 | 81% | 89% | 89% | 82% |
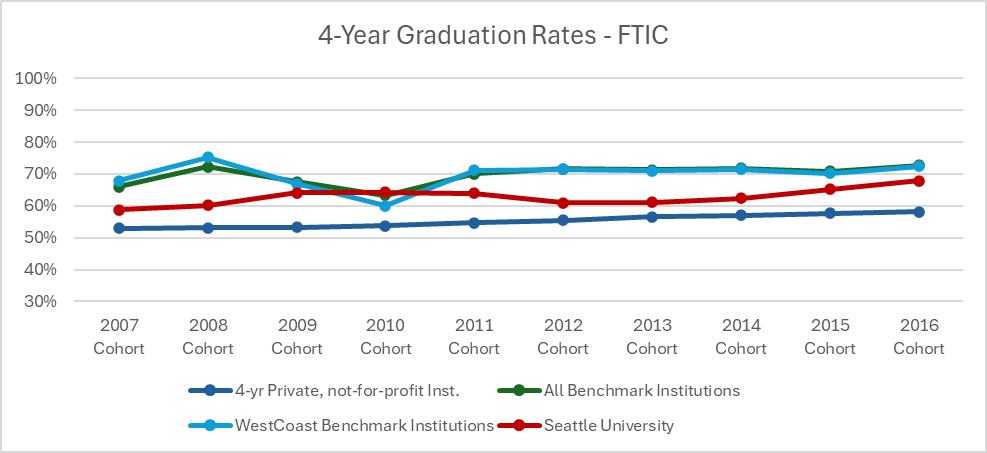
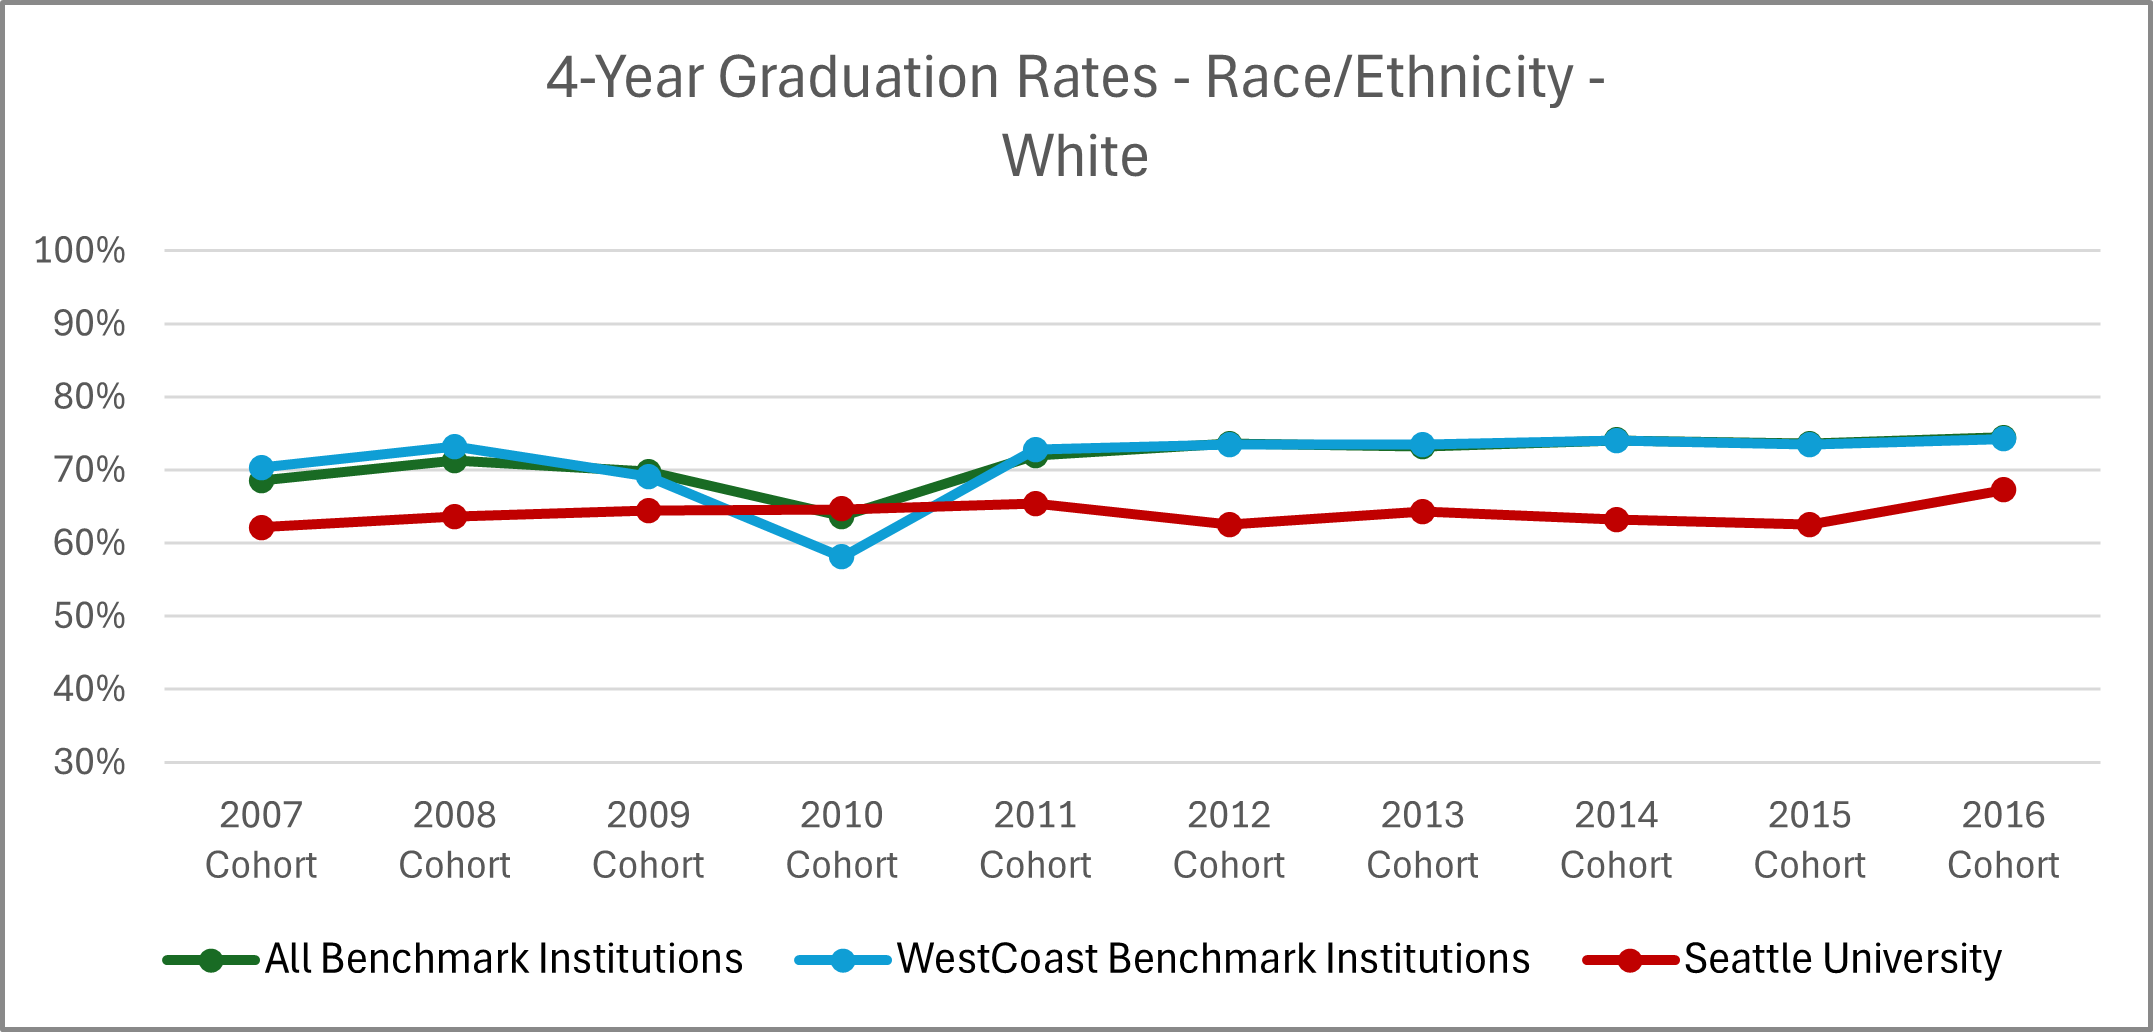
All Entering First-Time Full-Time Undergraduates
| Cohort Year | 4-yr Private, not-for-profit Inst. | All Benchmark Institutions | WestCoast Benchmark Institutions | Seattle University |
|---|---|---|---|---|
| 2007 Cohort | 53% | 66% | 68% | 59% |
| 2008 Cohort | 53% | 72% | 75% | 60% |
| 2009 Cohort | 53% | 68% | 67% | 64% |
| 2010 Cohort | 54% | 63% | 60% | 64% |
| 2011 Cohort | 55% | 70% | 71% | 64% |
| 2012 Cohort | 56% | 72% | 71% | 61% |
| 2013 Cohort | 57% | 71% | 71% | 61% |
| 2014 Cohort | 57% | 72% | 71% | 62% |
| 2015 Cohort | 58% | 71% | 70% | 65% |
| 2016 Cohort | 58% | 73% | 72% | 68% |
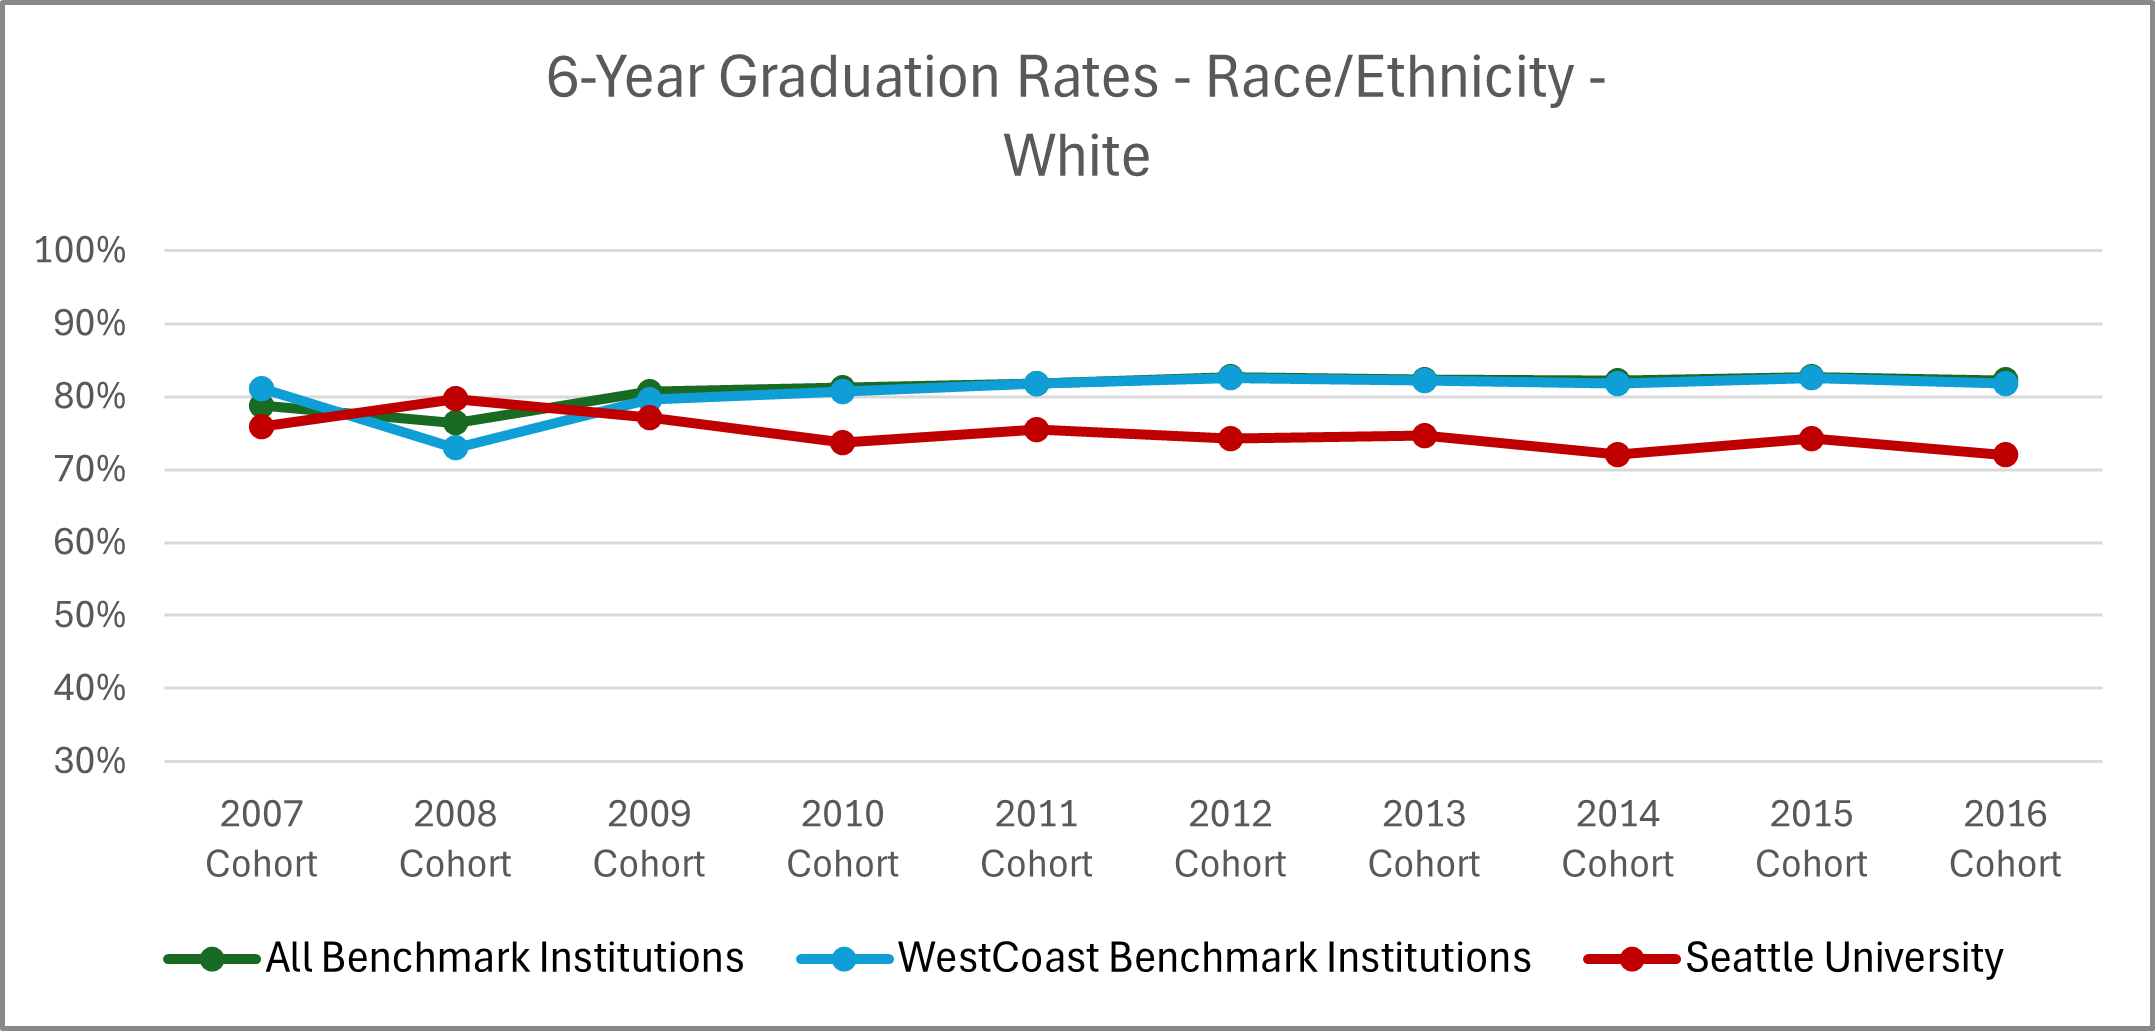
| Cohort Year | 4-yr Private, not-for-profit Inst. | All Benchmark Institutions | WestCoast Benchmark Institutions | Seattle University |
|---|---|---|---|---|
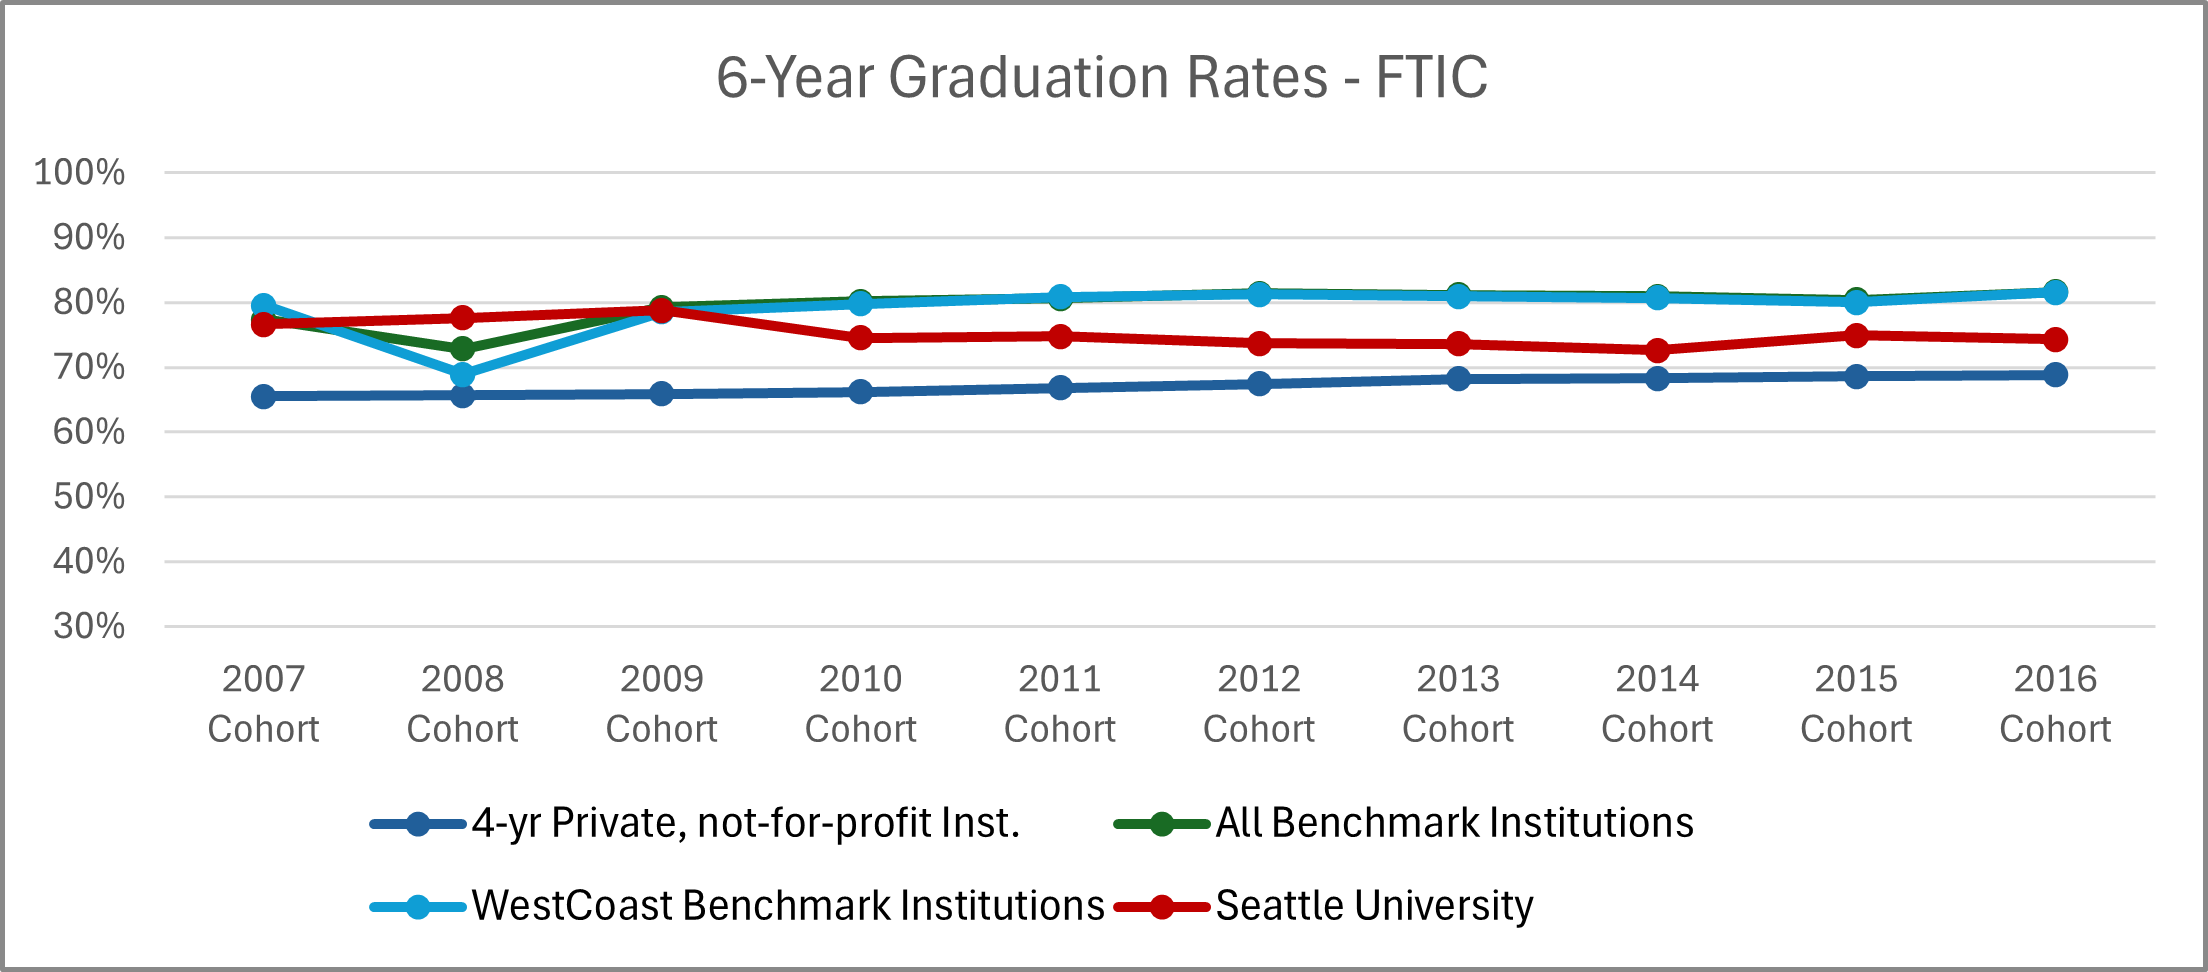
| 2007 Cohort | 66% | 77% | 80% | 77% |
| 2008 Cohort | 66% | 73% | 69% | 78% |
| 2009 Cohort | 66% | 79% | 79% | 79% |
| 2010 Cohort | 66% | 80% | 80% | 75% |
| 2011 Cohort | 67% | 81% | 81% | 75% |
| 2012 Cohort | 67% | 81% | 81% | 74% |
| 2013 Cohort | 68% | 81% | 81% | 74% |
| 2014 Cohort | 68% | 81% | 81% | 73% |
| 2015 Cohort | 69% | 80% | 80% | 75% |
| 2016 Cohort | 69% | 82% | 82% | 74% |
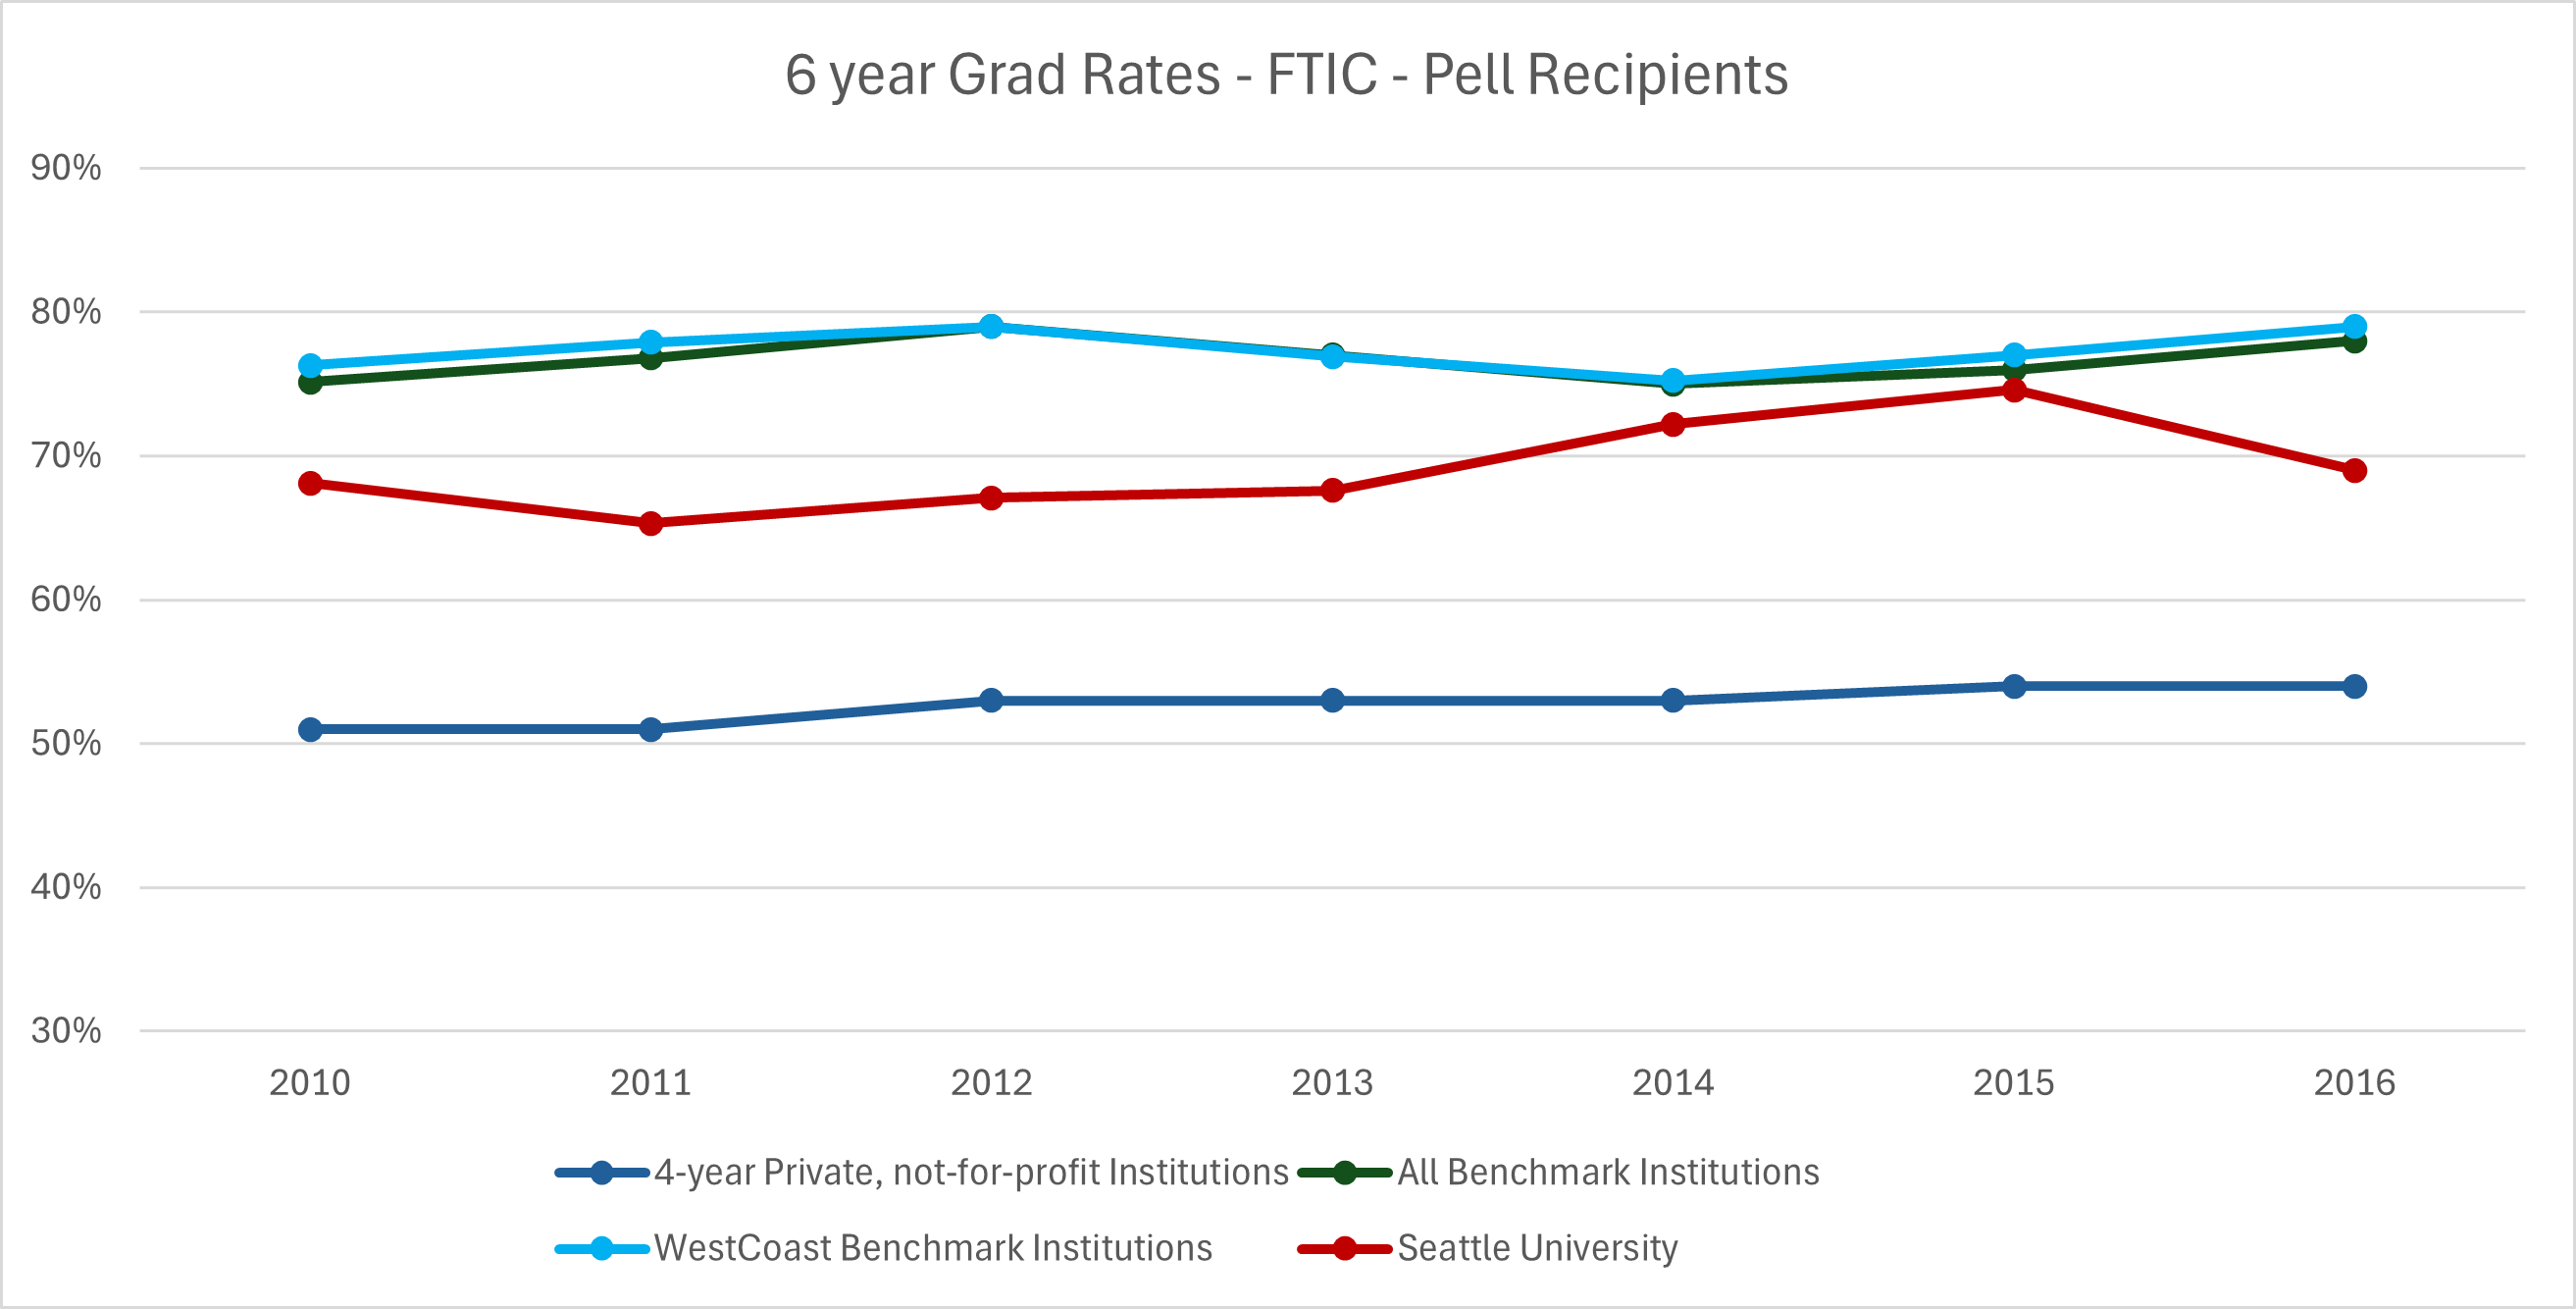
Pell Eligible (Lower Income) Students
| Cohort Year | 4-yr Private, not-for-profit Institutions | All Benchmark Institutions | WestCoast Benchmark Institutions | Seattle University |
|---|---|---|---|---|
| 2010 Cohort | 51% | 75% | 76% | 68% |
| 2011 Cohort | 51% | 77% | 78% | 65% |
| 2012 Cohort | 53% | 79% | 79% | 67% |
| 2013 Cohort | 53% | 77% | 77% | 68% |
| 2014 Cohort | 53% | 75% | 75% | 72% |
| 2015 Cohort | 54% | 76% | 77% | 75% |
| 2016 Cohort | 54% | 78% | 79% | 69% |
Gender
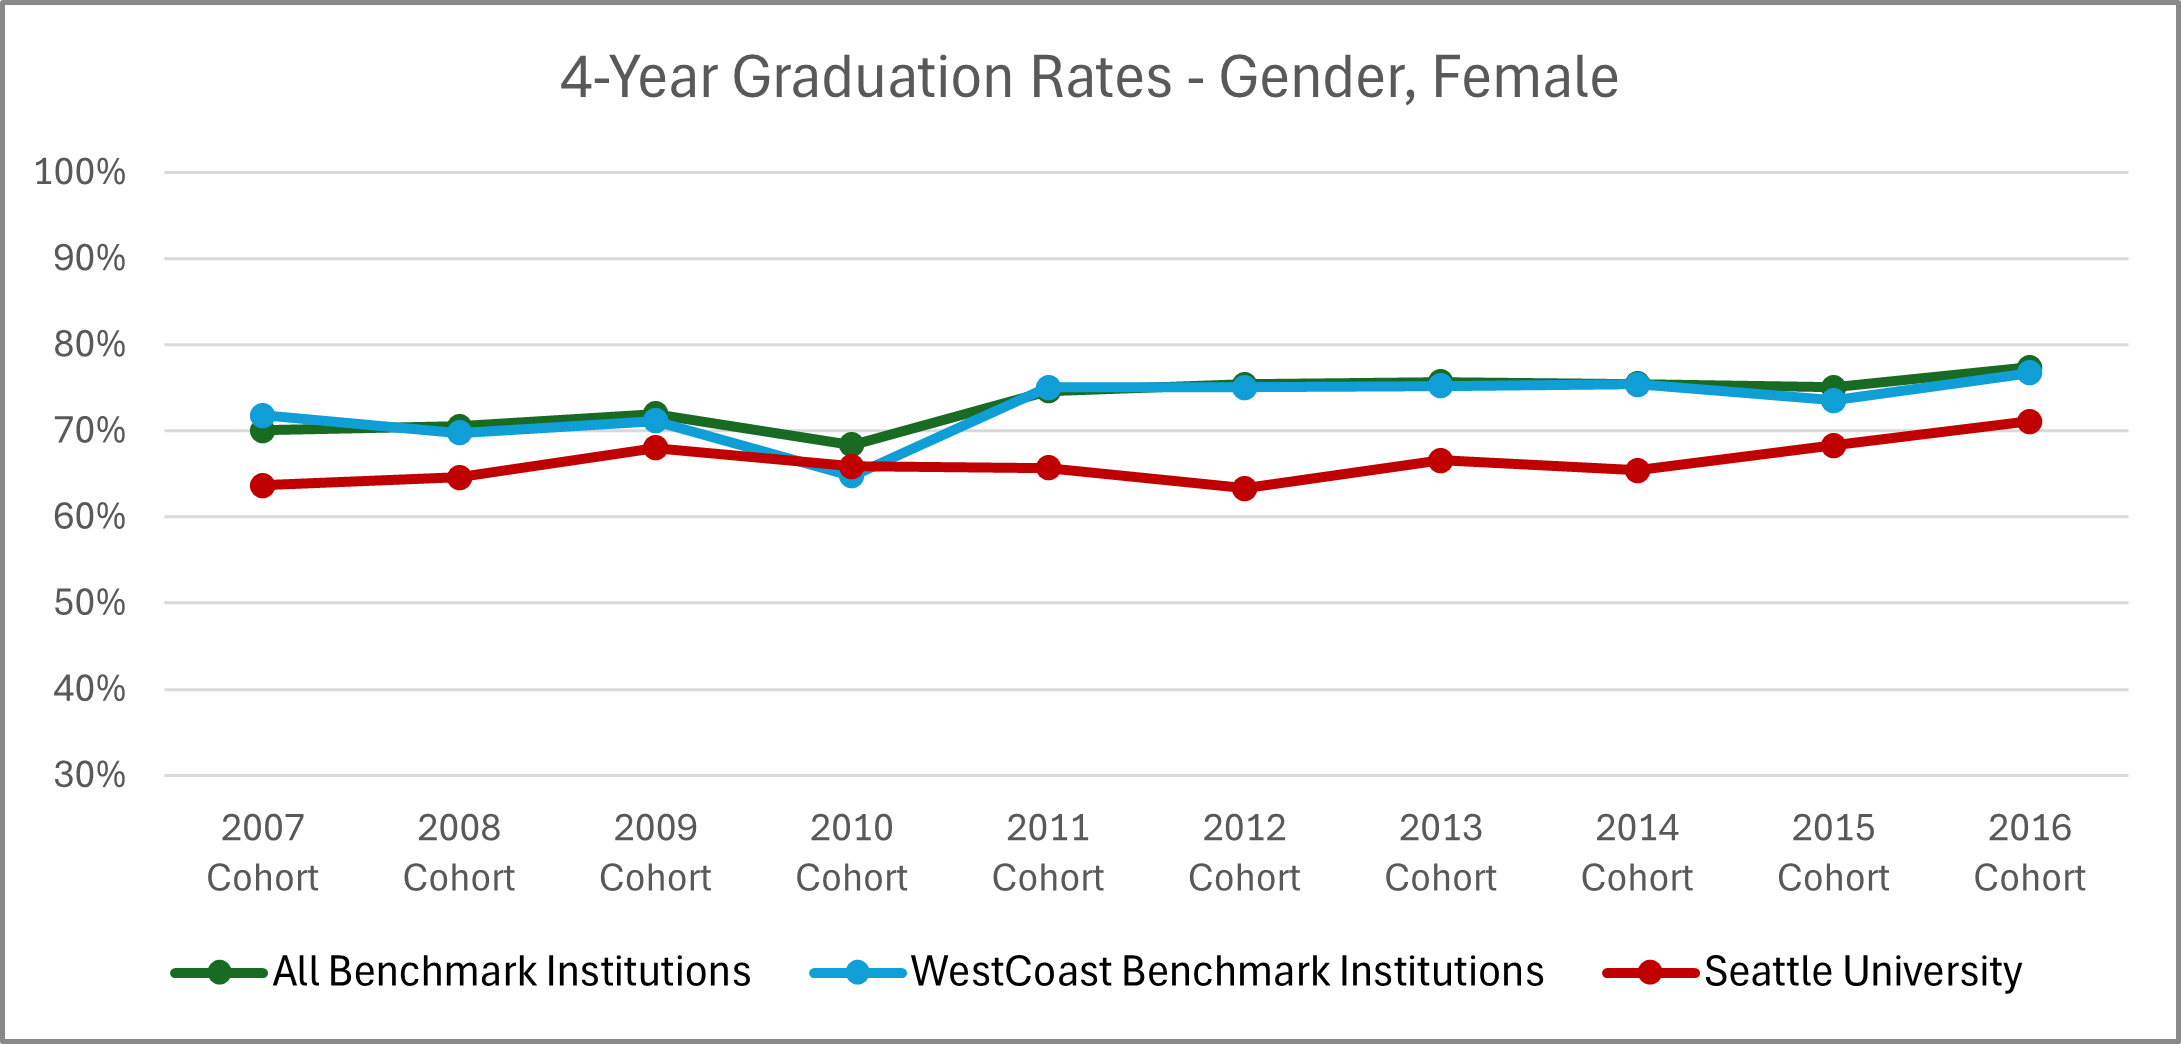
| Cohort | All Benchmark Institutions | WestCoast Benchmark Institutions | Seattle University |
|---|---|---|---|
| 2007 | 70% | 72% | 64% |
| 2008 | 71% | 70% | 65% |
| 2009 | 72% | 71% | 68% |
| 2010 | 68% | 65% | 66% |
| 2011 | 75% | 75% | 66% |
| 2012 | 75% | 75% | 63% |
| 2013 | 76% | 75% | 67% |
| 2014 | 75% | 75% | 65% |
| 2015 | 75% | 74% | 68% |
| 2016 | 77% | 77% | 71% |
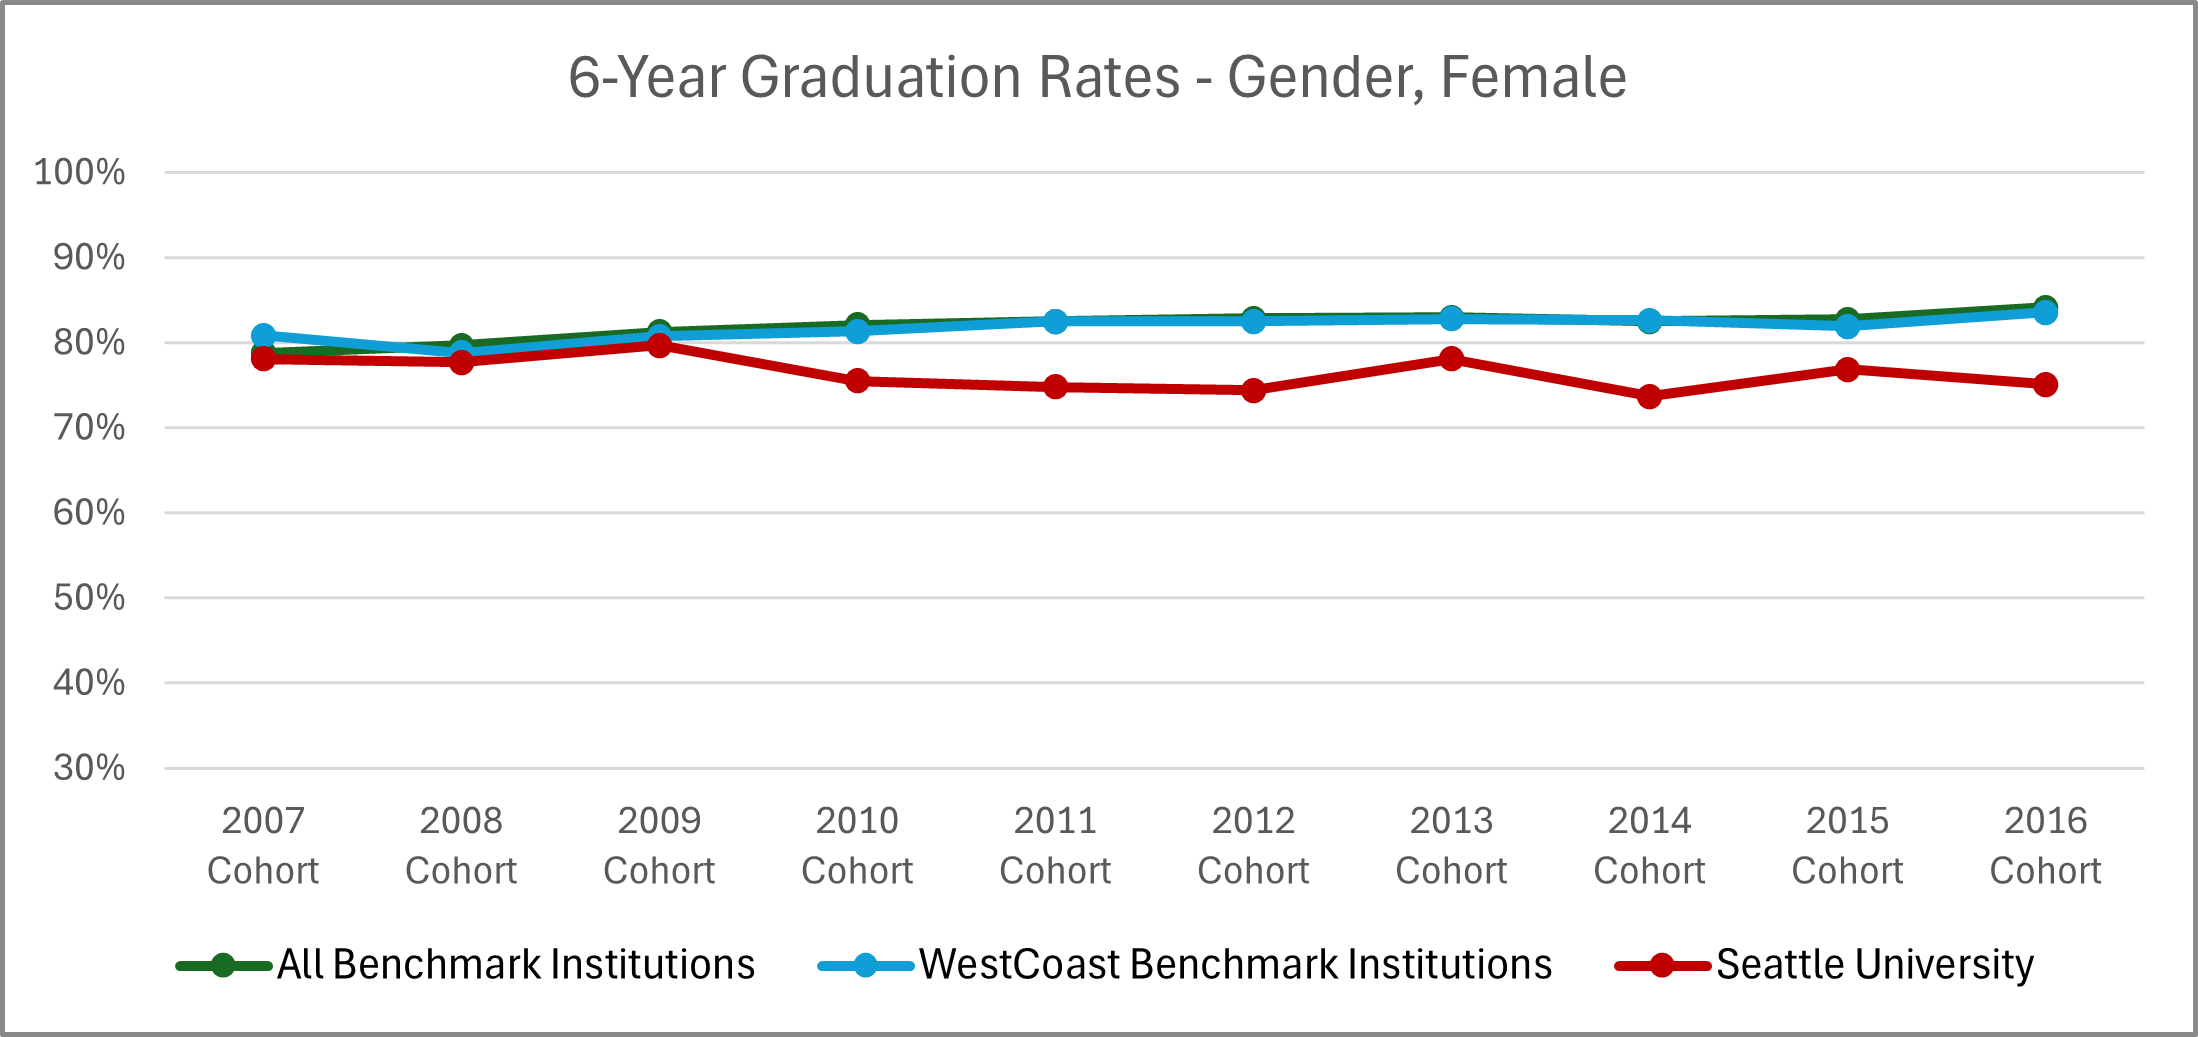
| Cohort | All Benchmark Institutions | WestCoast Benchmark Institutions | Seattle University |
|---|---|---|---|
| 2007 | 79% | 81% | 78% |
| 2008 | 80% | 79% | 78% |
| 2009 | 81% | 81% | 80% |
| 2010 | 82% | 81% | 76% |
| 2011 | 82% | 83% | 75% |
| 2012 | 83% | 83% | 74% |
| 2013 | 83% | 83% | 78% |
| 2014 | 83% | 83% | 74% |
| 2015 | 83% | 82% | 77% |
| 2016 | 84% | 84% | 75% |
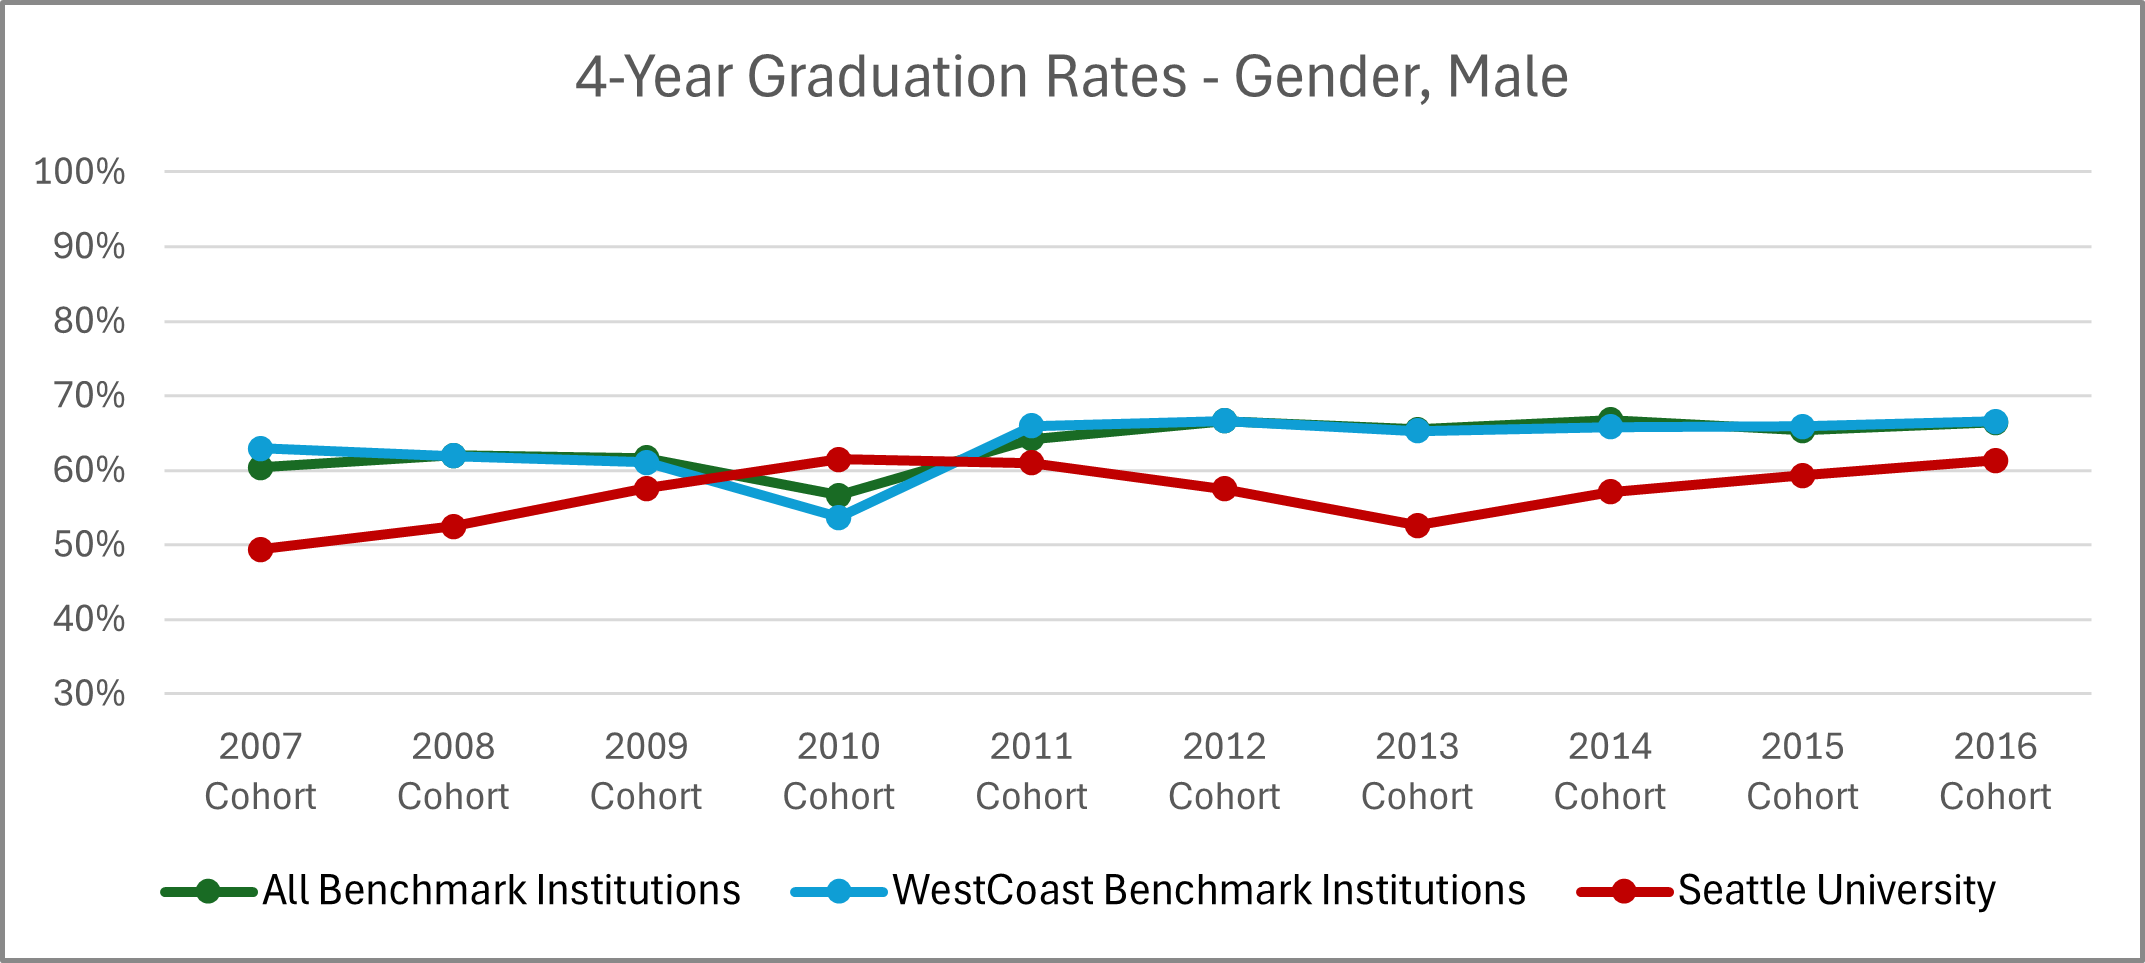
| Cohort | All Benchmark Institutions | WestCoast Benchmark Institutions | Seattle University |
|---|---|---|---|
| 2007 | 60% | 63% | 49% |
| 2008 | 62% | 62% | 53% |
| 2009 | 62% | 61% | 58% |
| 2010 | 57% | 54% | 62% |
| 2011 | 64% | 66% | 61% |
| 2012 | 67% | 67% | 58% |
| 2013 | 65% | 65% | 53% |
| 2014 | 67% | 66% | 57% |
| 2015 | 65% | 66% | 59% |
| 2016 | 66% | 67% | 61% |
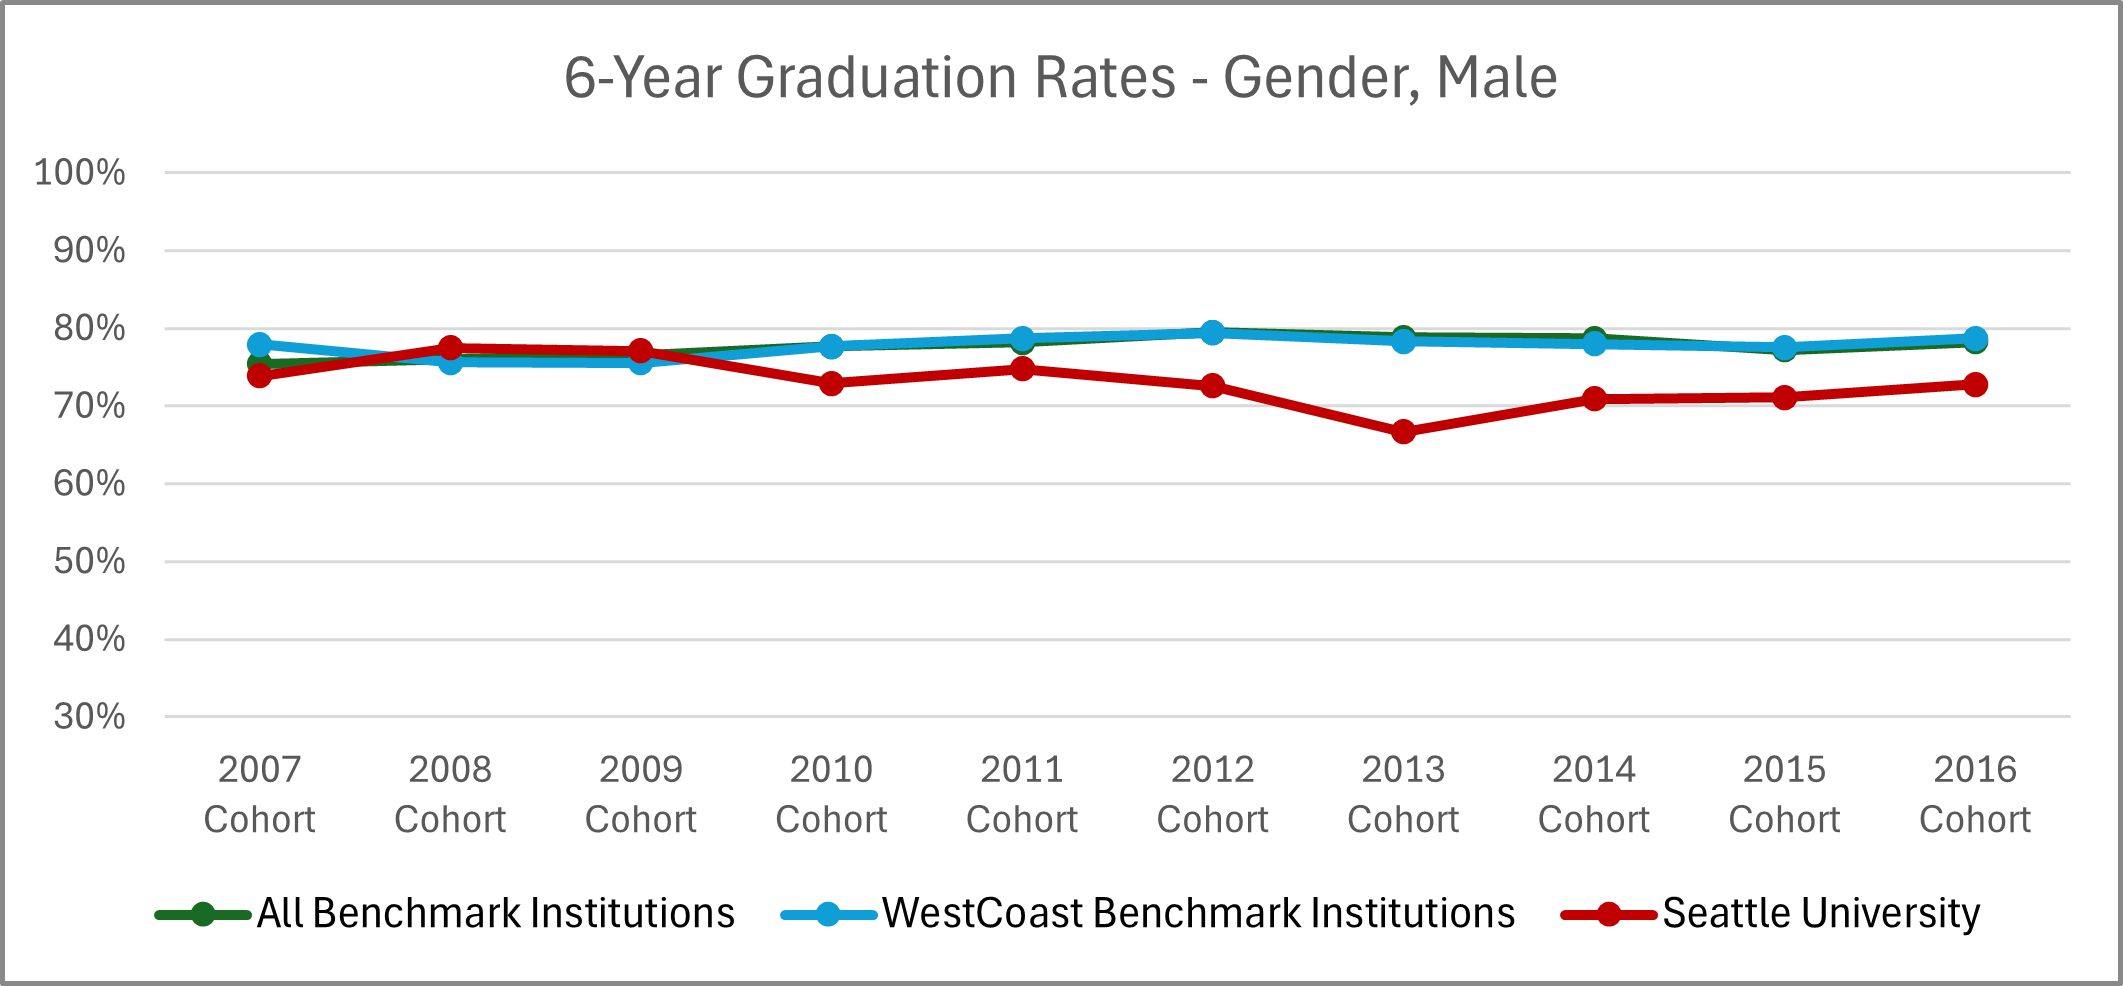
| Cohort | All Benchmark Institutions | WestCoast Benchmark Institutions | Seattle University |
|---|---|---|---|
| 2007 | 75% | 78% | 74% |
| 2008 | 76% | 76% | 78% |
| 2009 | 77% | 76% | 77% |
| 2010 | 78% | 78% | 73% |
| 2011 | 78% | 79% | 75% |
| 2012 | 79% | 79% | 73% |
| 2013 | 79% | 78% | 67% |
| 2014 | 79% | 78% | 71% |
| 2015 | 77% | 78% | 71% |
| 2016 | 78% | 79% | 73% |
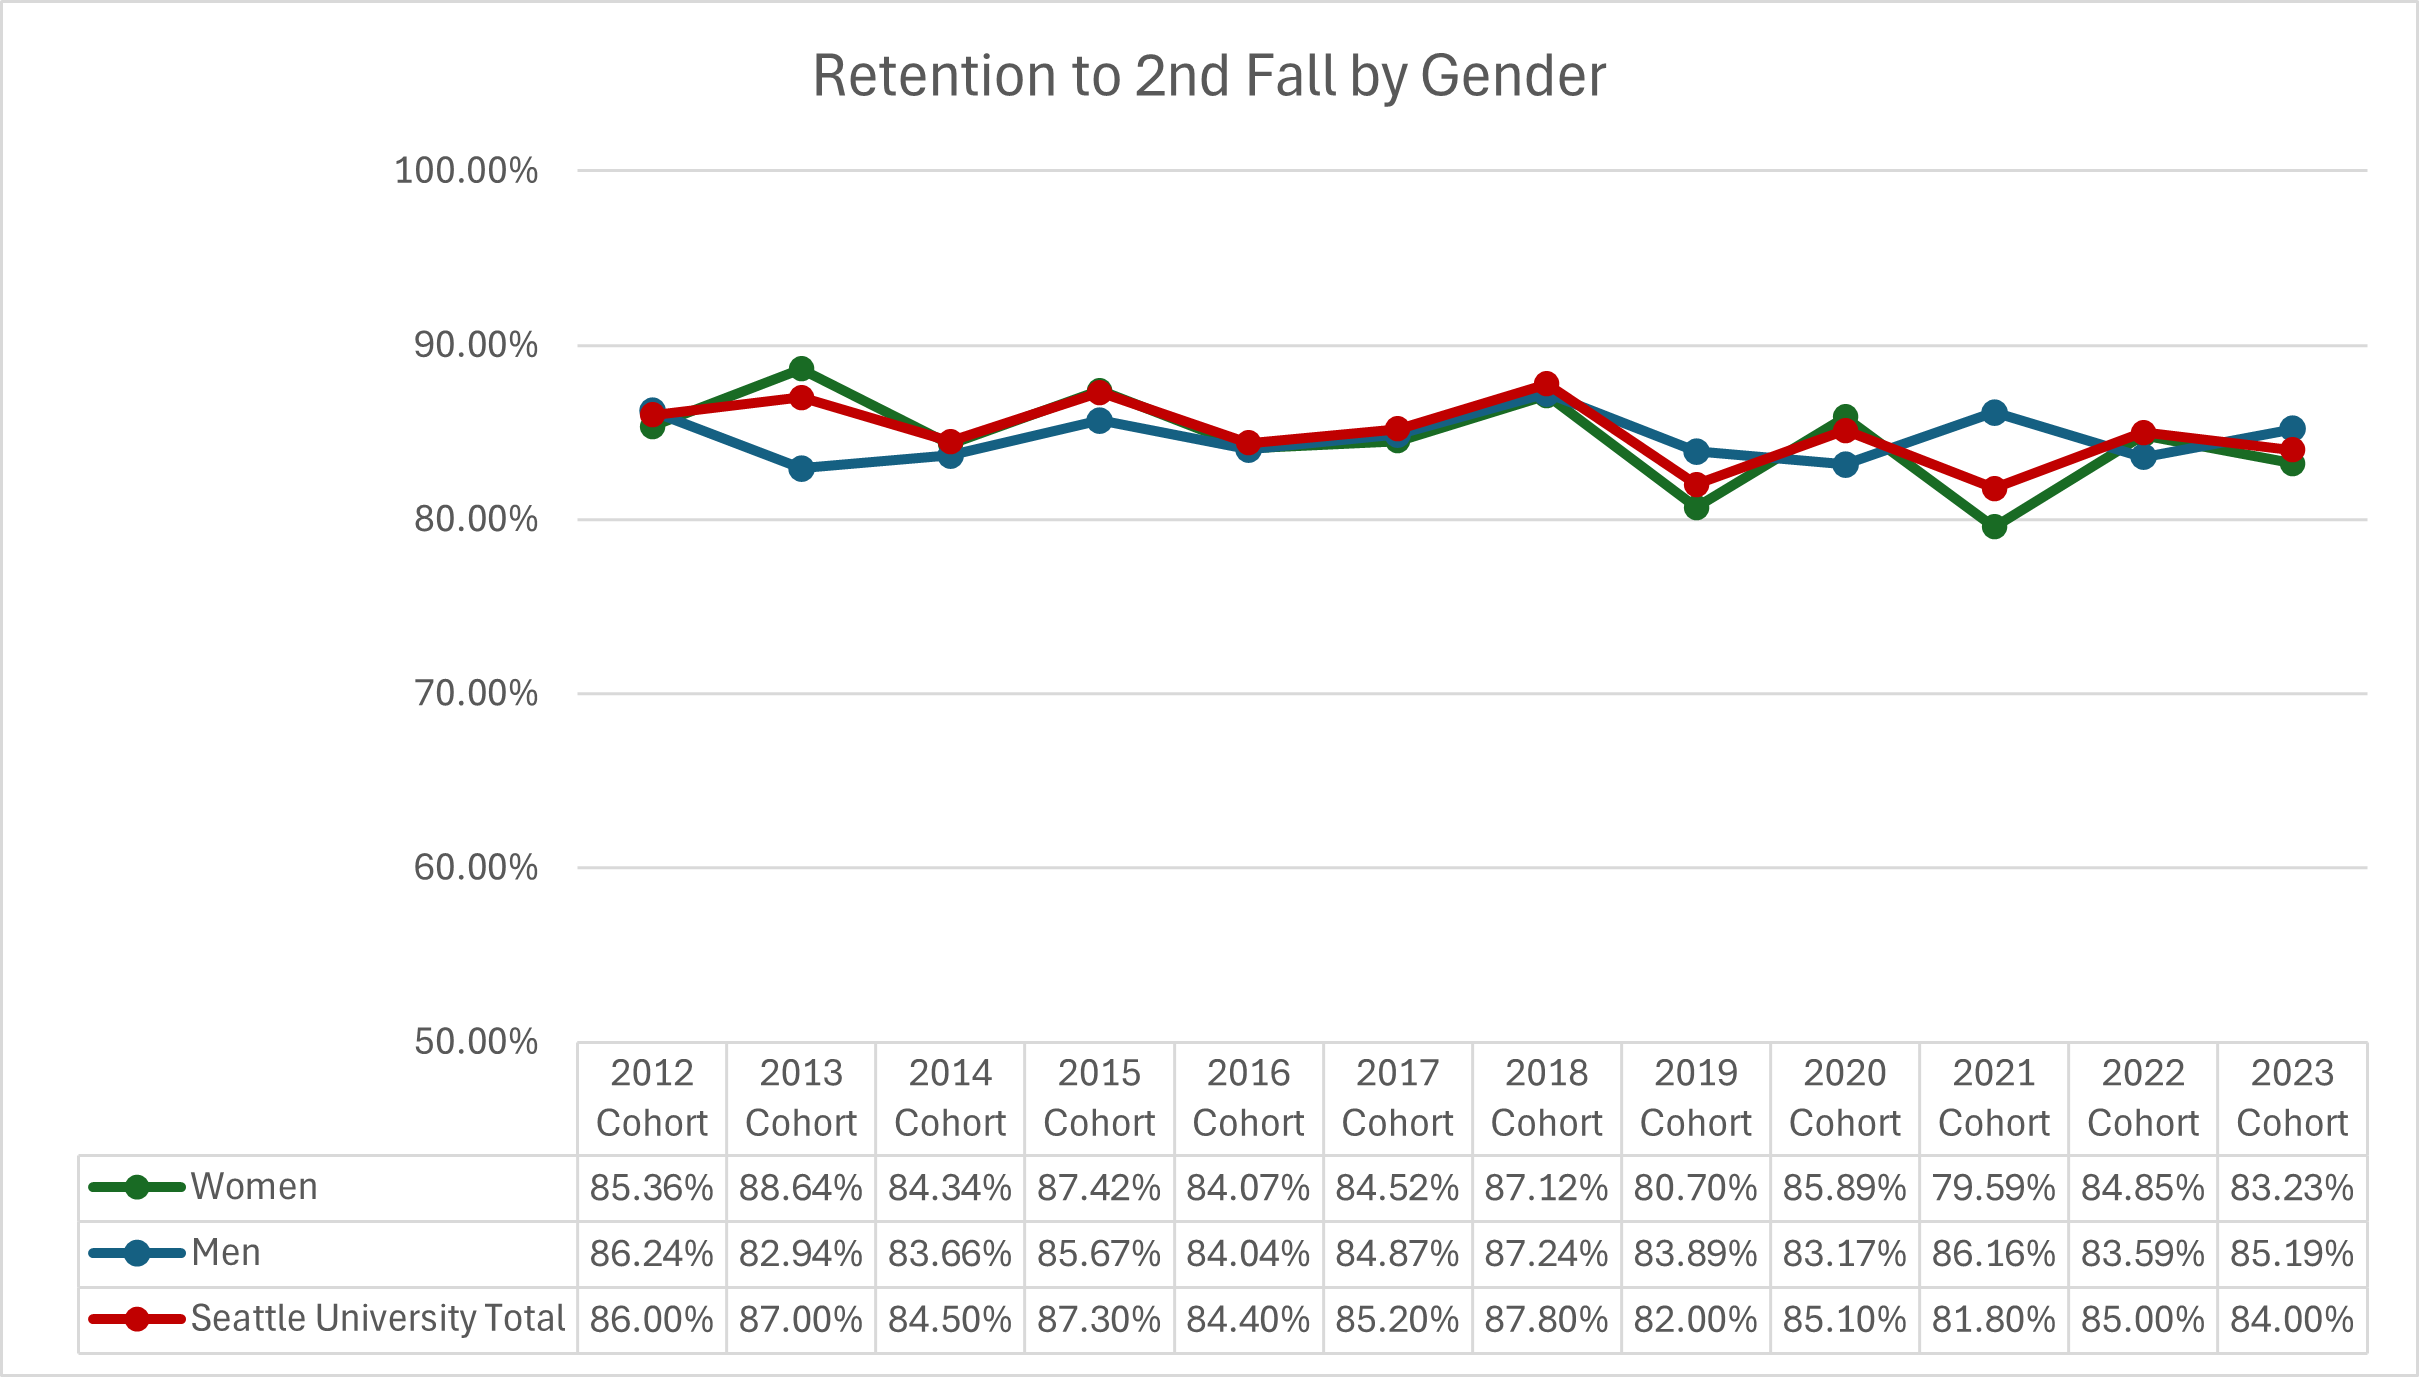
| Cohort | Women | Men | Seattle University Total |
|---|---|---|---|
| 2012 | 85.36% | 86.24% | 86.00% |
| 2013 | 88.64% | 82.94% | 87.00% |
| 2014 | 84.34% | 83.66% | 84.50% |
| 2015 | 87.42% | 85.67% | 87.30% |
| 2016 | 84.07% | 84.04% | 84.40% |
| 2017 | 84.52% | 84.87% | 85.20% |
| 2018 | 87.12% | 87.24% | 87.80% |
| 2019 | 80.70% | 83.89% | 82.00% |
| 2020 | 85.89% | 83.17% | 85.10% |
| 2021 | 79.59% | 86.16% | 81.80% |
| 2022 | 84.85% | 83.59% | 85.00% |
| 2023 | 83.23% | 85.19% | 84.00% |
Race/Ethnicity Groups
Graduation Rates - BIPOC Students
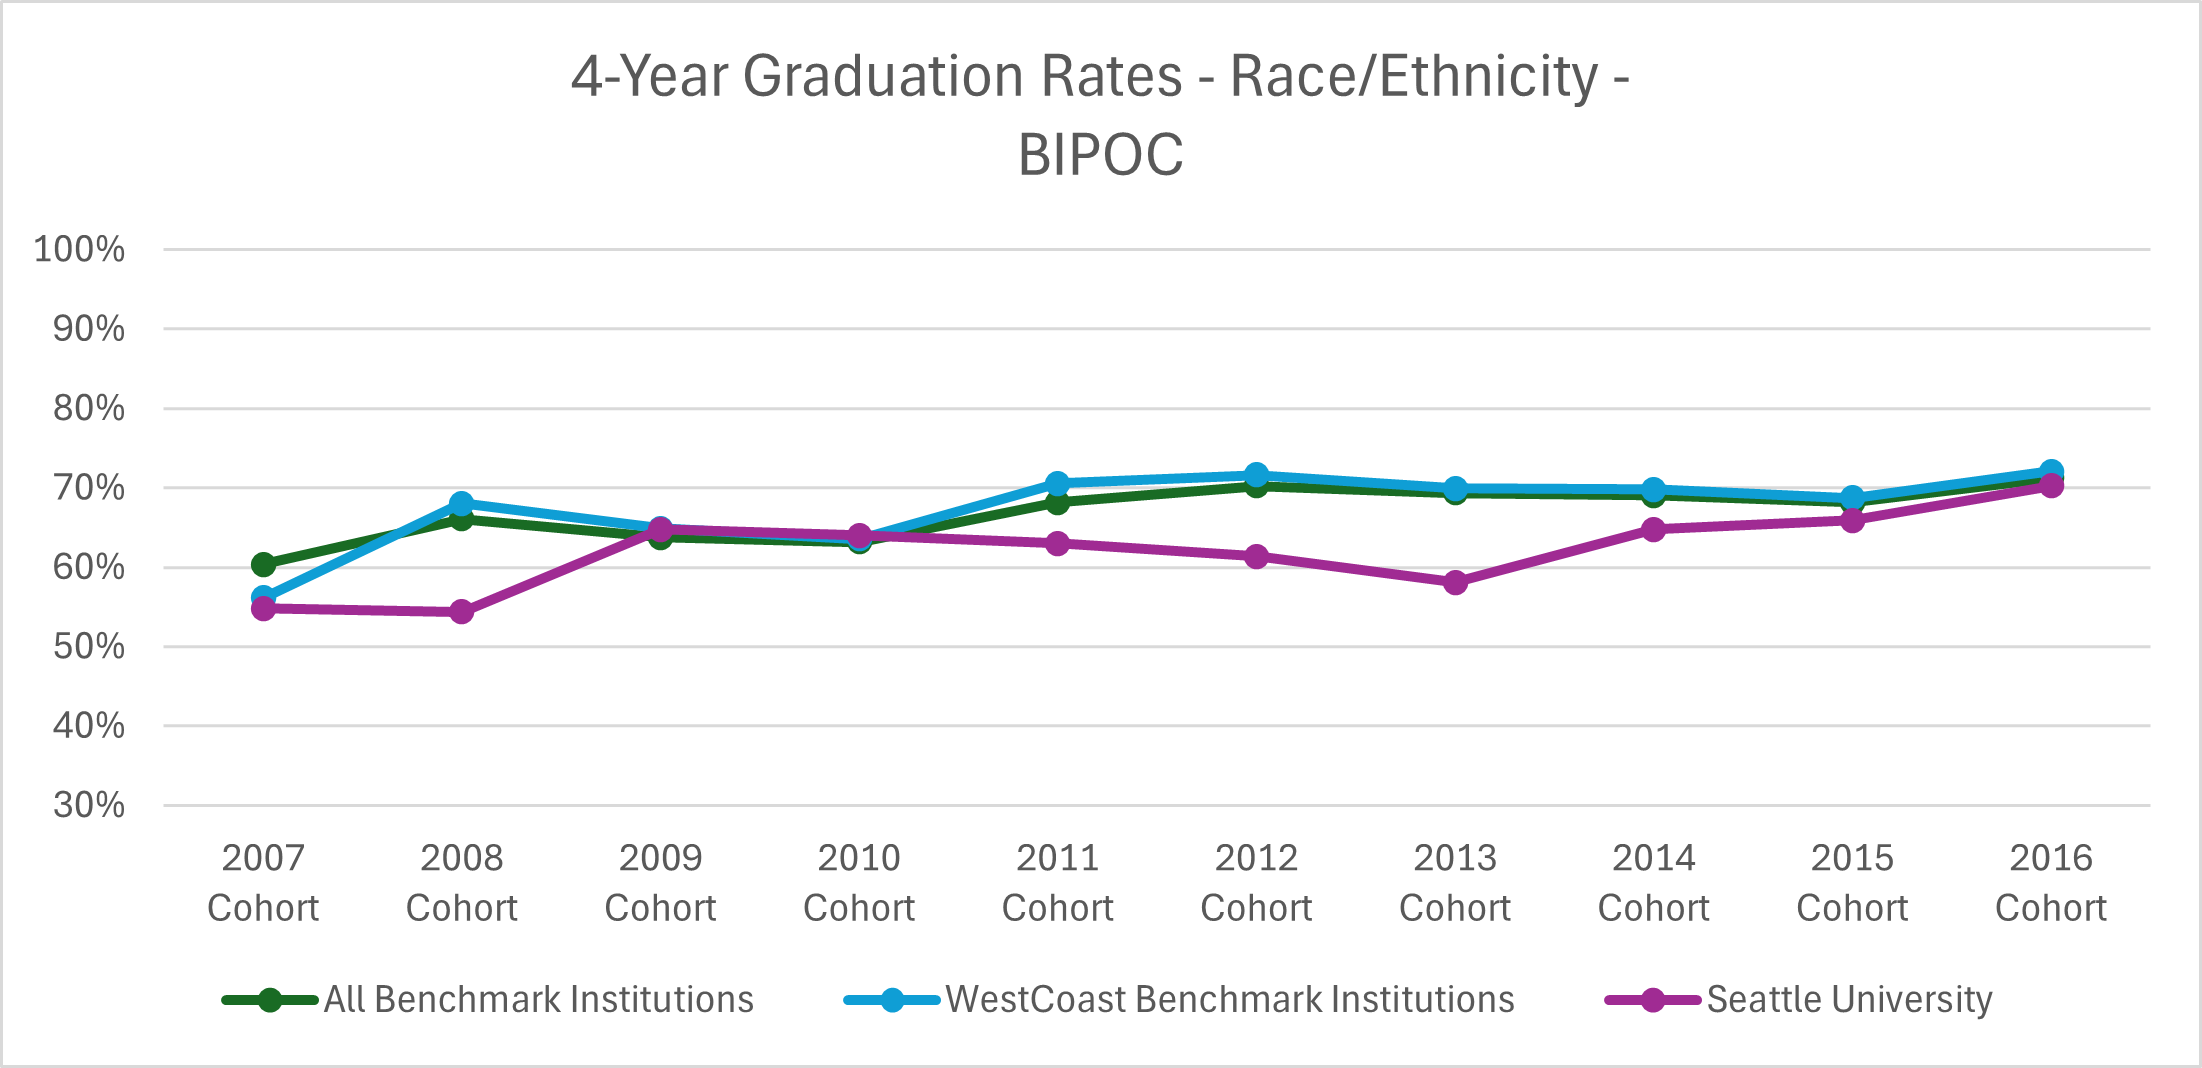
| Cohort | All Benchmark Institutions | WestCoast Benchmark Institutions | Seattle University |
|---|---|---|---|
| 2007 | 60% | 56% | 55% |
| 2008 | 66% | 68% | 54% |
| 2009 | 64% | 65% | 65% |
| 2010 | 63% | 64% | 64% |
| 2011 | 68% | 71% | 63% |
| 2012 | 70% | 72% | 61% |
| 2013 | 69% | 70% | 58% |
| 2014 | 69% | 70% | 65% |
| 2015 | 68% | 69% | 66% |
| 2016 | 71% | 72% | 70% |
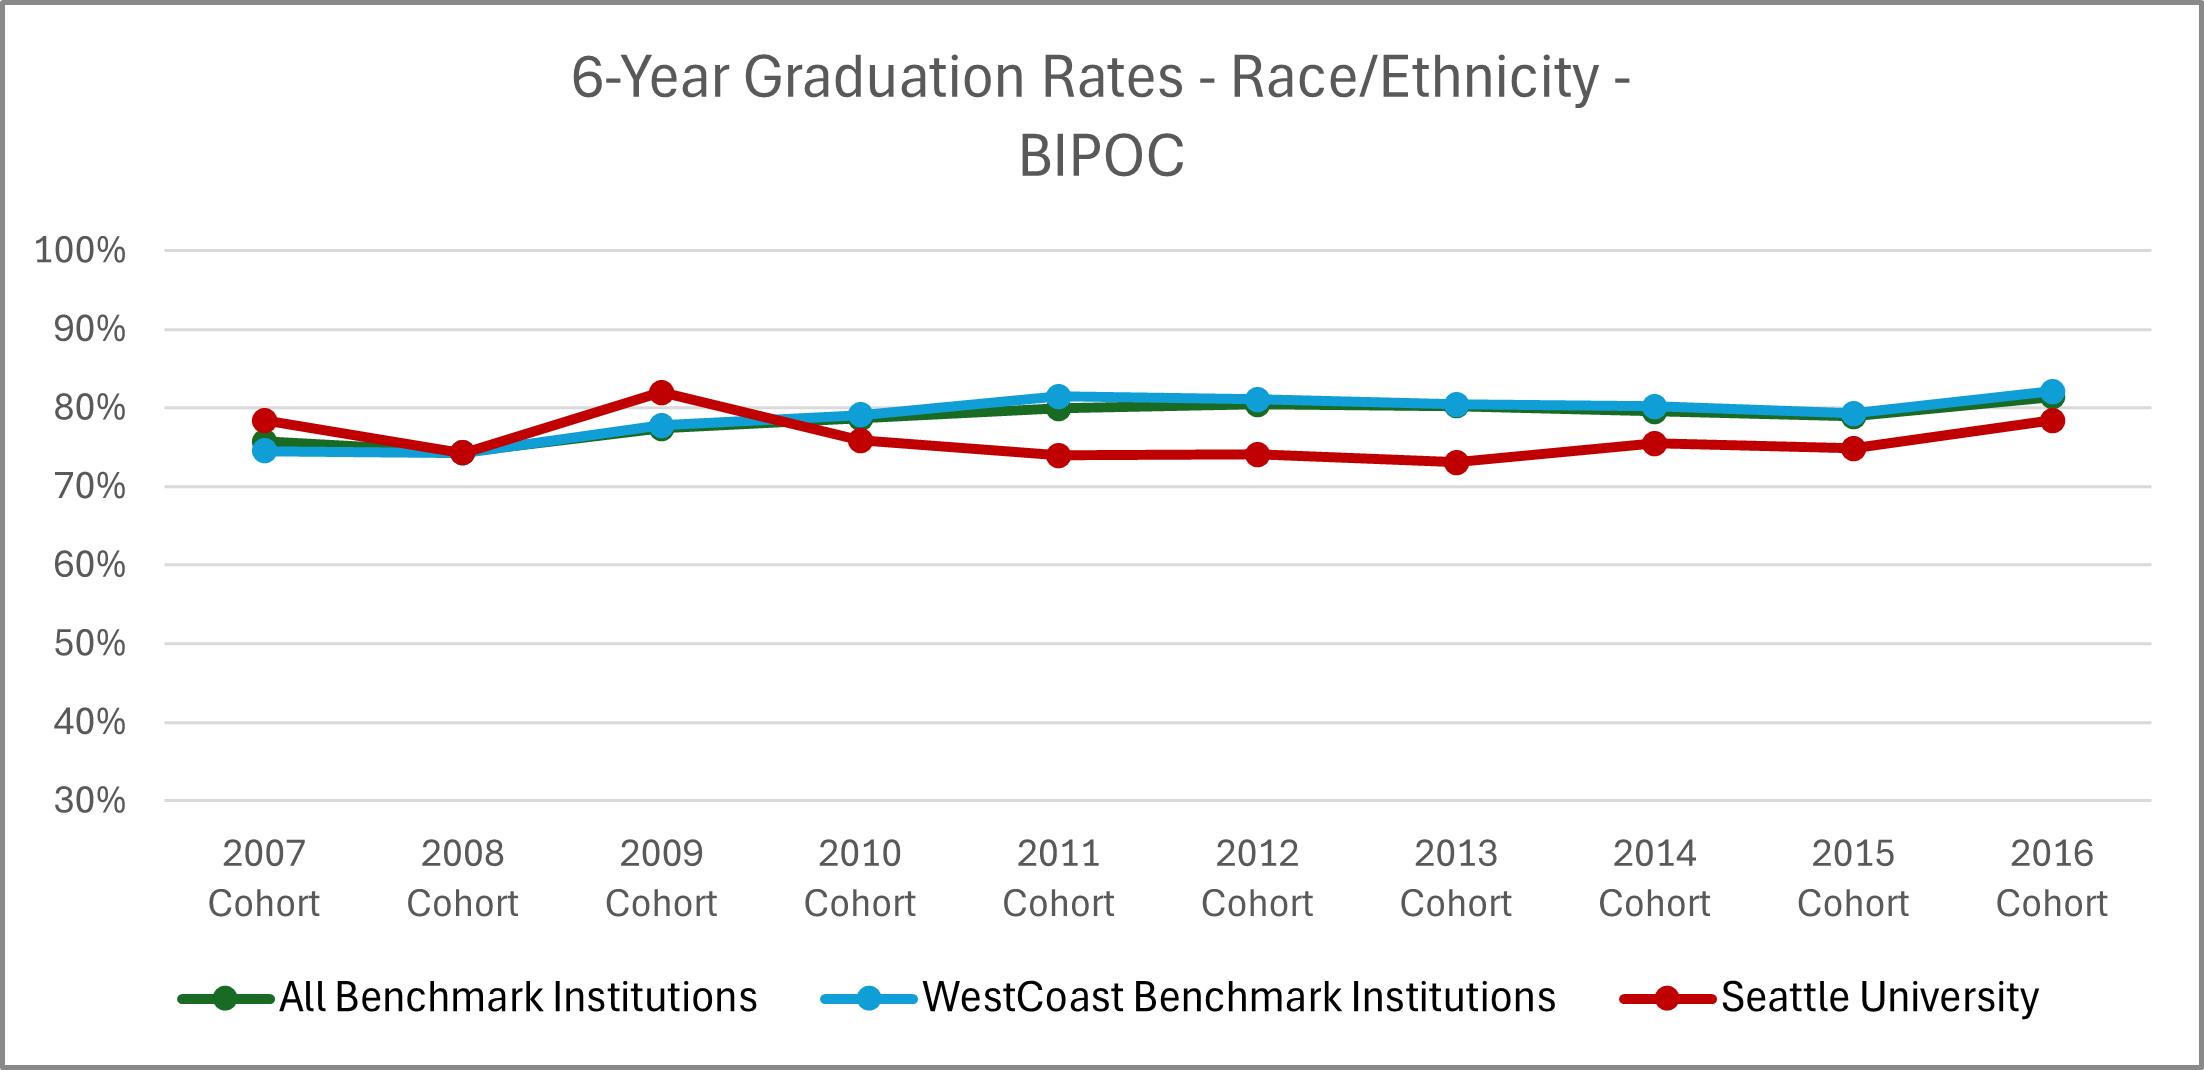
| Cohort | All Benchmark Institutions | WestCoast Benchmark Institutions | Seattle University |
|---|---|---|---|
| 2007 | 76% | 75% | 78% |
| 2008 | 74% | 74% | 74% |
| 2009 | 77% | 78% | 82% |
| 2010 | 79% | 79% | 76% |
| 2011 | 80% | 81% | 74% |
| 2012 | 80% | 81% | 74% |
| 2013 | 80% | 80% | 73% |
| 2014 | 80% | 80% | 75% |
| 2015 | 79% | 79% | 75% |
| 2016 | 81% | 82% | 78% |
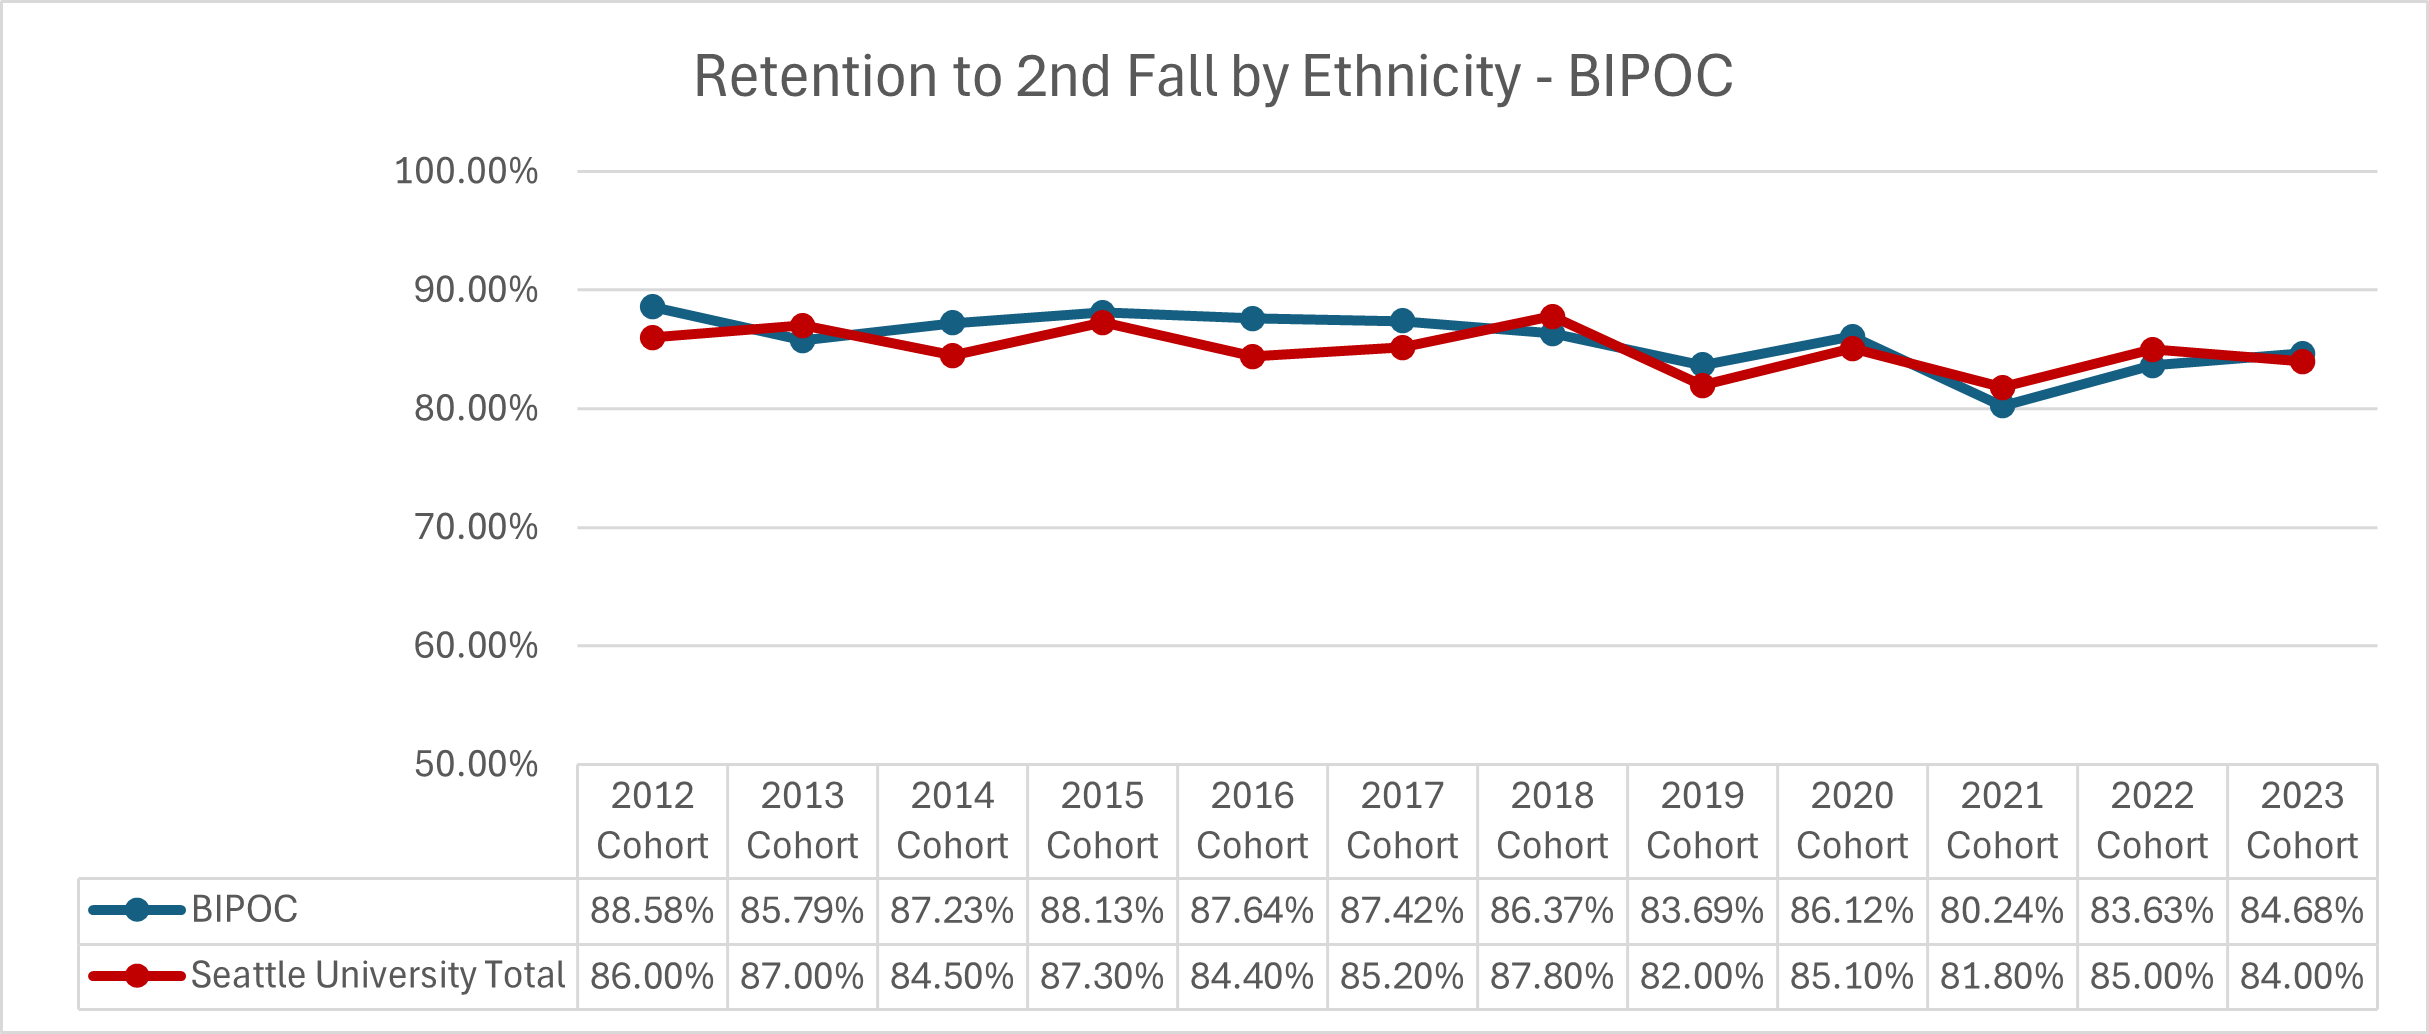
| Cohort | BIPOC | Seattle University Total |
|---|---|---|
| 2012 | 88.58% | 86.00% |
| 2013 | 85.79% | 87.00% |
| 2014 | 87.23% | 84.50% |
| 2015 | 88.13% | 87.30% |
| 2016 | 87.64% | 84.40% |
| 2017 | 87.42% | 85.20% |
| 2018 | 86.37% | 87.80% |
| 2019 | 83.69% | 82.00% |
| 2020 | 86.12% | 85.10% |
| 2021 | 80.24% | 81.80% |
| 2022 | 83.63% | 85.00% |
| 2023 | 84.68% | 84.00% |
Graduation Rates - Alaskan and Native American
This graph displays the 4-year and 6-year graduation rates for Alaskan and Native American students at different benchmark institutions and Seattle University.
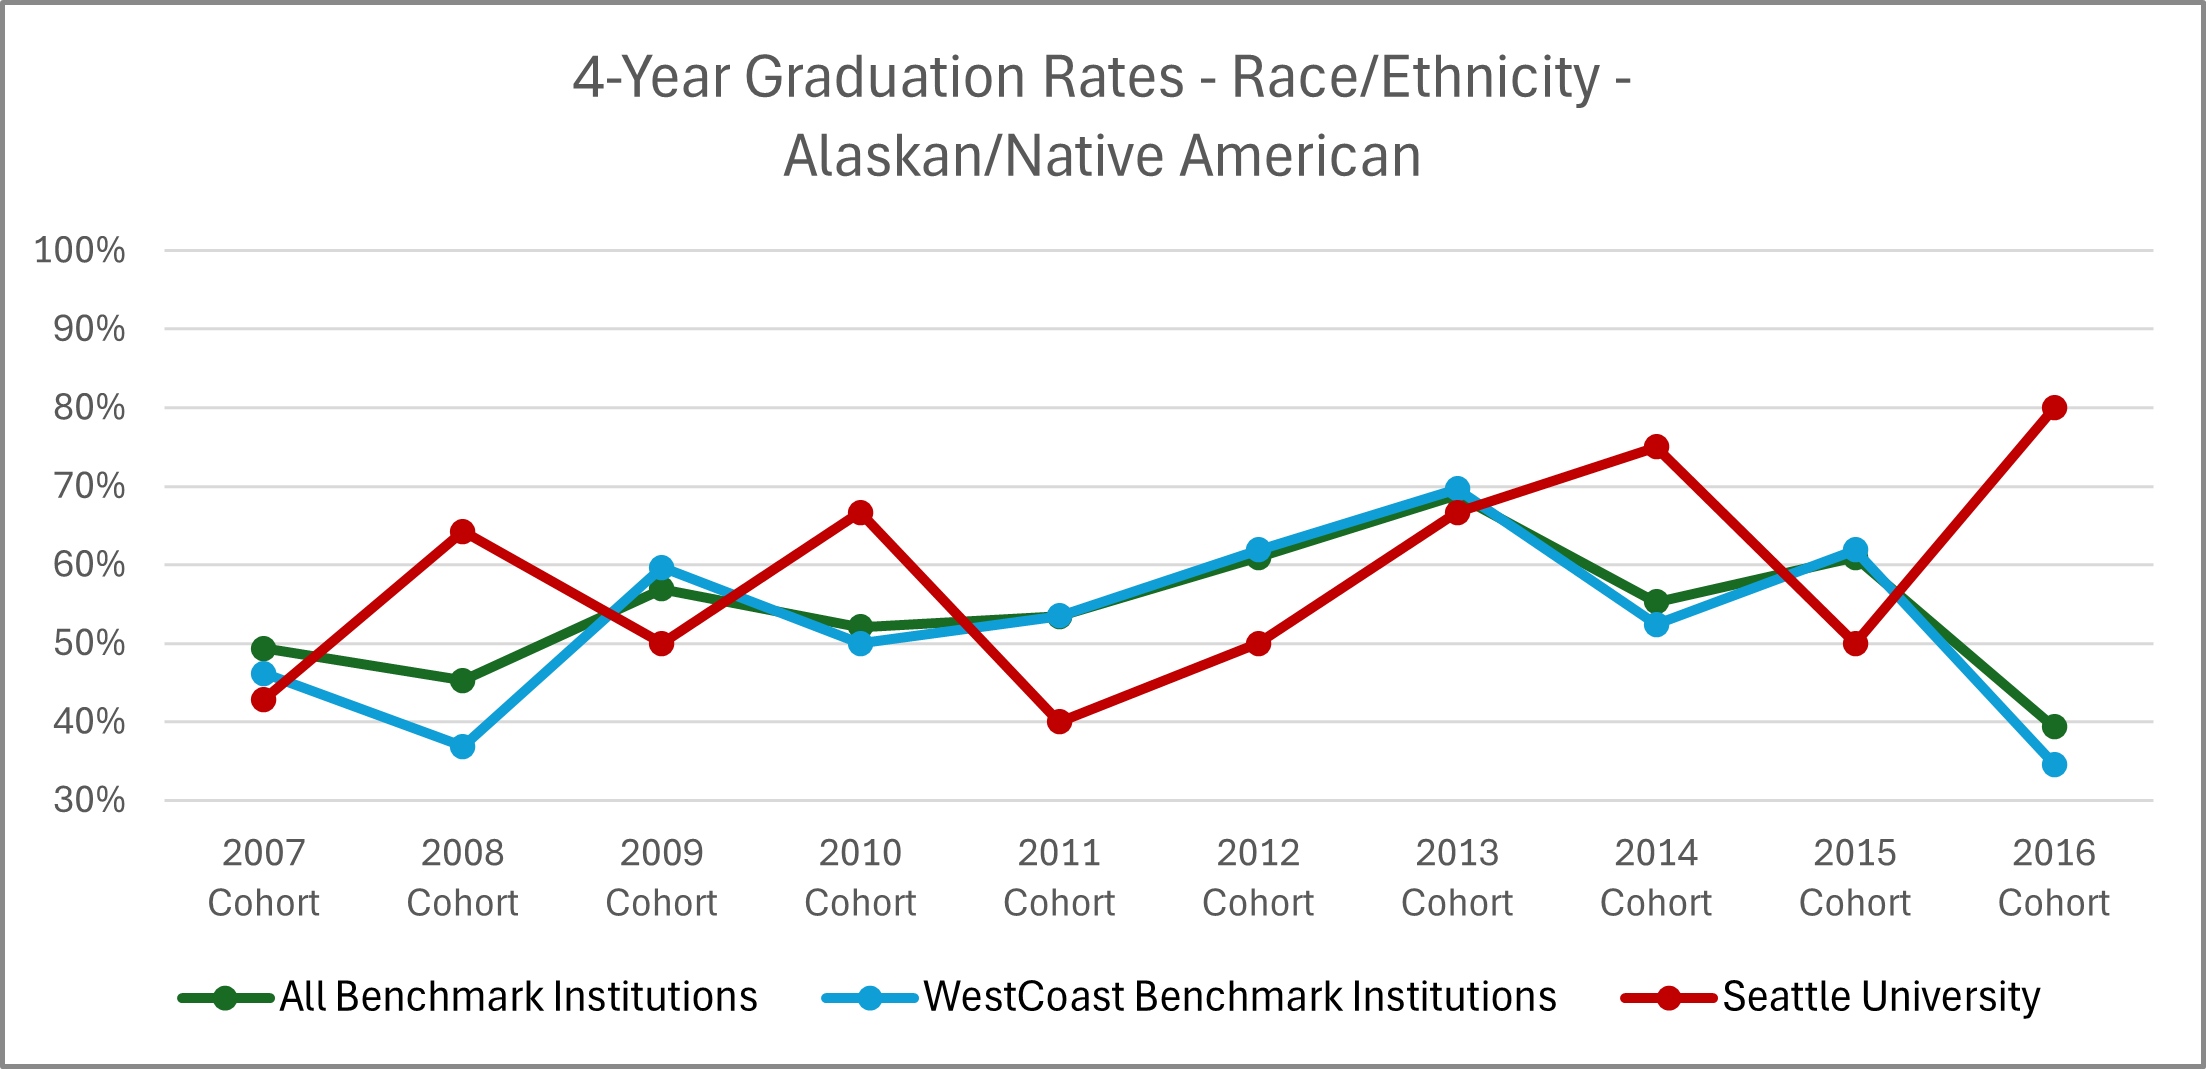
| Cohort | All Benchmark Institutions | WestCoast Benchmark Institutions | Seattle University |
|---|---|---|---|
| 2007 | 49% | 46% | 43% |
| 2008 | 45% | 37% | 64% |
| 2009 | 57% | 60% | 50% |
| 2010 | 52% | 50% | 67% |
| 2011 | 53% | 53% | 40% |
| 2012 | 6% | 62% | 50% |
| 2013 | 69% | 70% | 67% |
| 2014 | 55% | 52% | 75% |
| 2015 | 61% | 62% | 50% |
| 2016 | 39% | 35% | 80% |
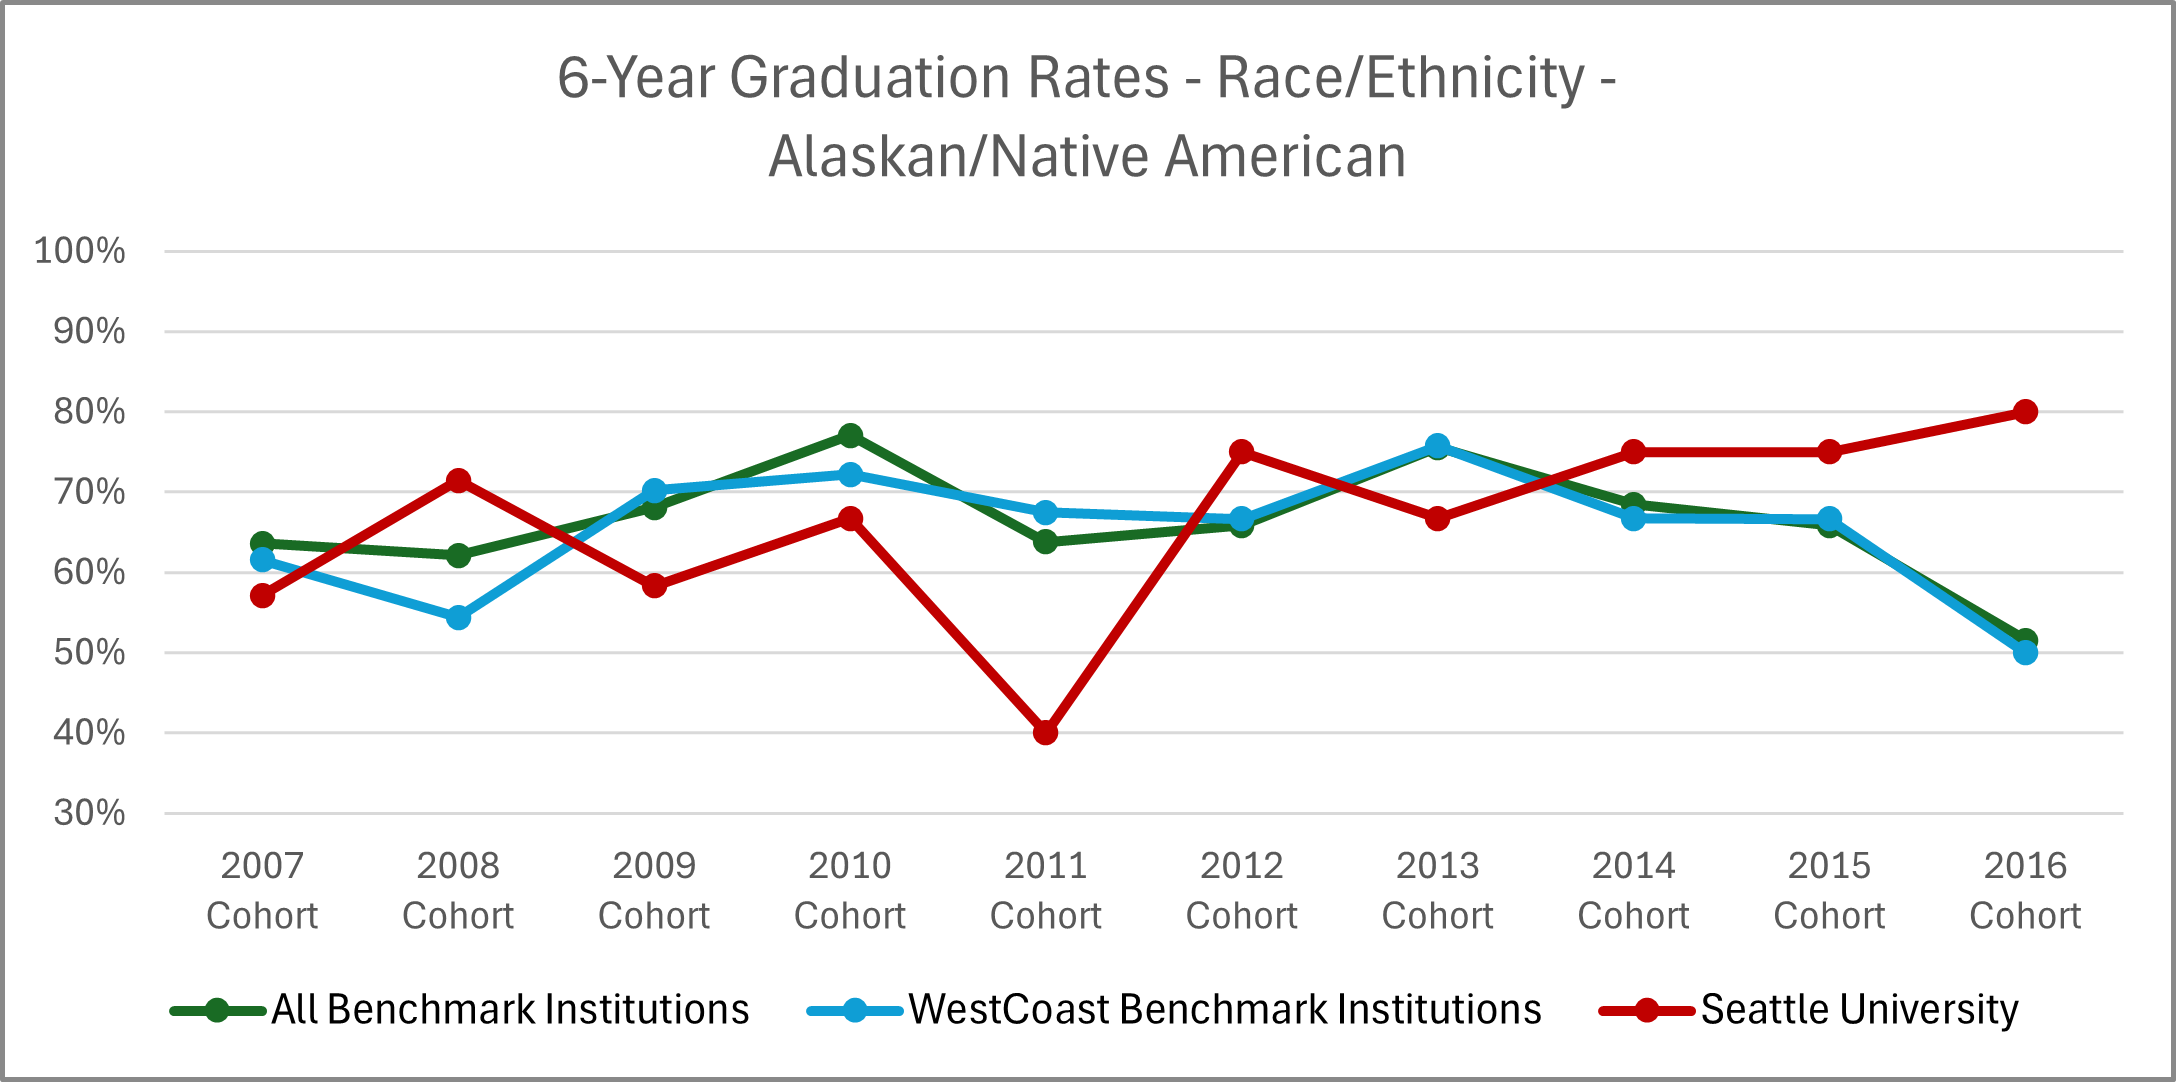
| Cohort | All Benchmark Institutions | WestCoast Benchmark Institutions | Seattle University |
|---|---|---|---|
| 2007 | 64% | 62% | 57% |
| 2008 | 62% | 54% | 71% |
| 2009 | 68% | 70% | 58% |
| 2010 | 77% | 72% | 67% |
| 2011 | 64% | 67% | 40% |
| 2012 | 66% | 67% | 75% |
| 2013 | 76% | 76% | 67% |
| 2014 | 68% | 67% | 75% |
| 2015 | 66% | 67% | 75% |
| 2016 | 52% | 50% | 80% |
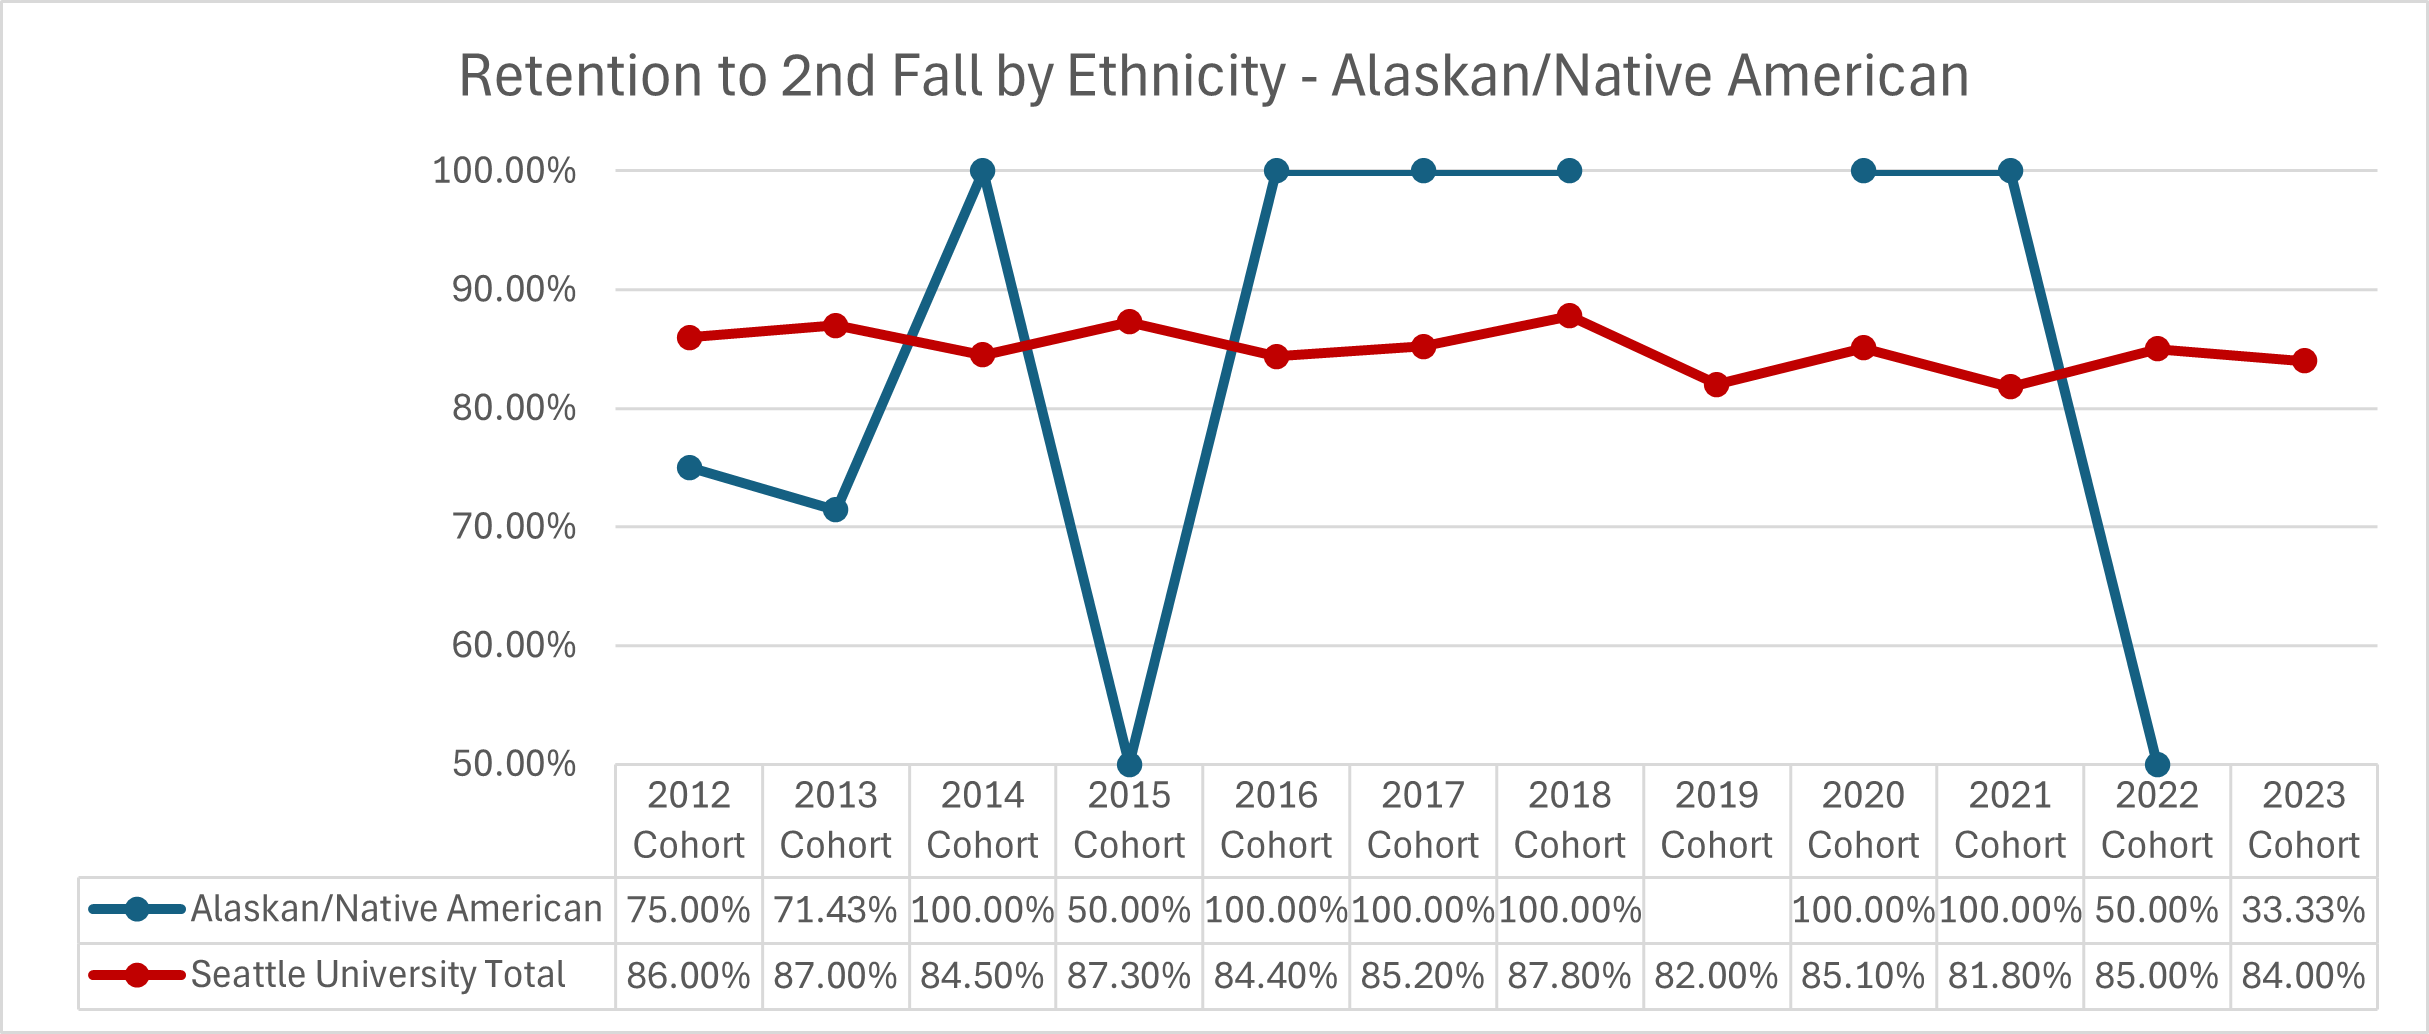
| Cohort Year | Alaskan/Native American | Seattle University Total |
|---|---|---|
| 2012 | 75.00% | 86.00% |
| 2013 | 71.43% | 87.00% |
| 2014 | 100.00% | 84.50% |
| 2015 | 50.00% | 87.30% |
| 2016 | 100.00% | 84.40% |
| 2017 | 100.00% | 85.20% |
| 2018 | 100.00% | 87.80% |
| 2019 | 0% | 82.00% |
| 2020 | 100.00% | 85.10% |
| 2021 | 100.00% | 81.80% |
| 2022 | 50.00% | 85.00% |
| 2023 | 33.33% | 84.00% |
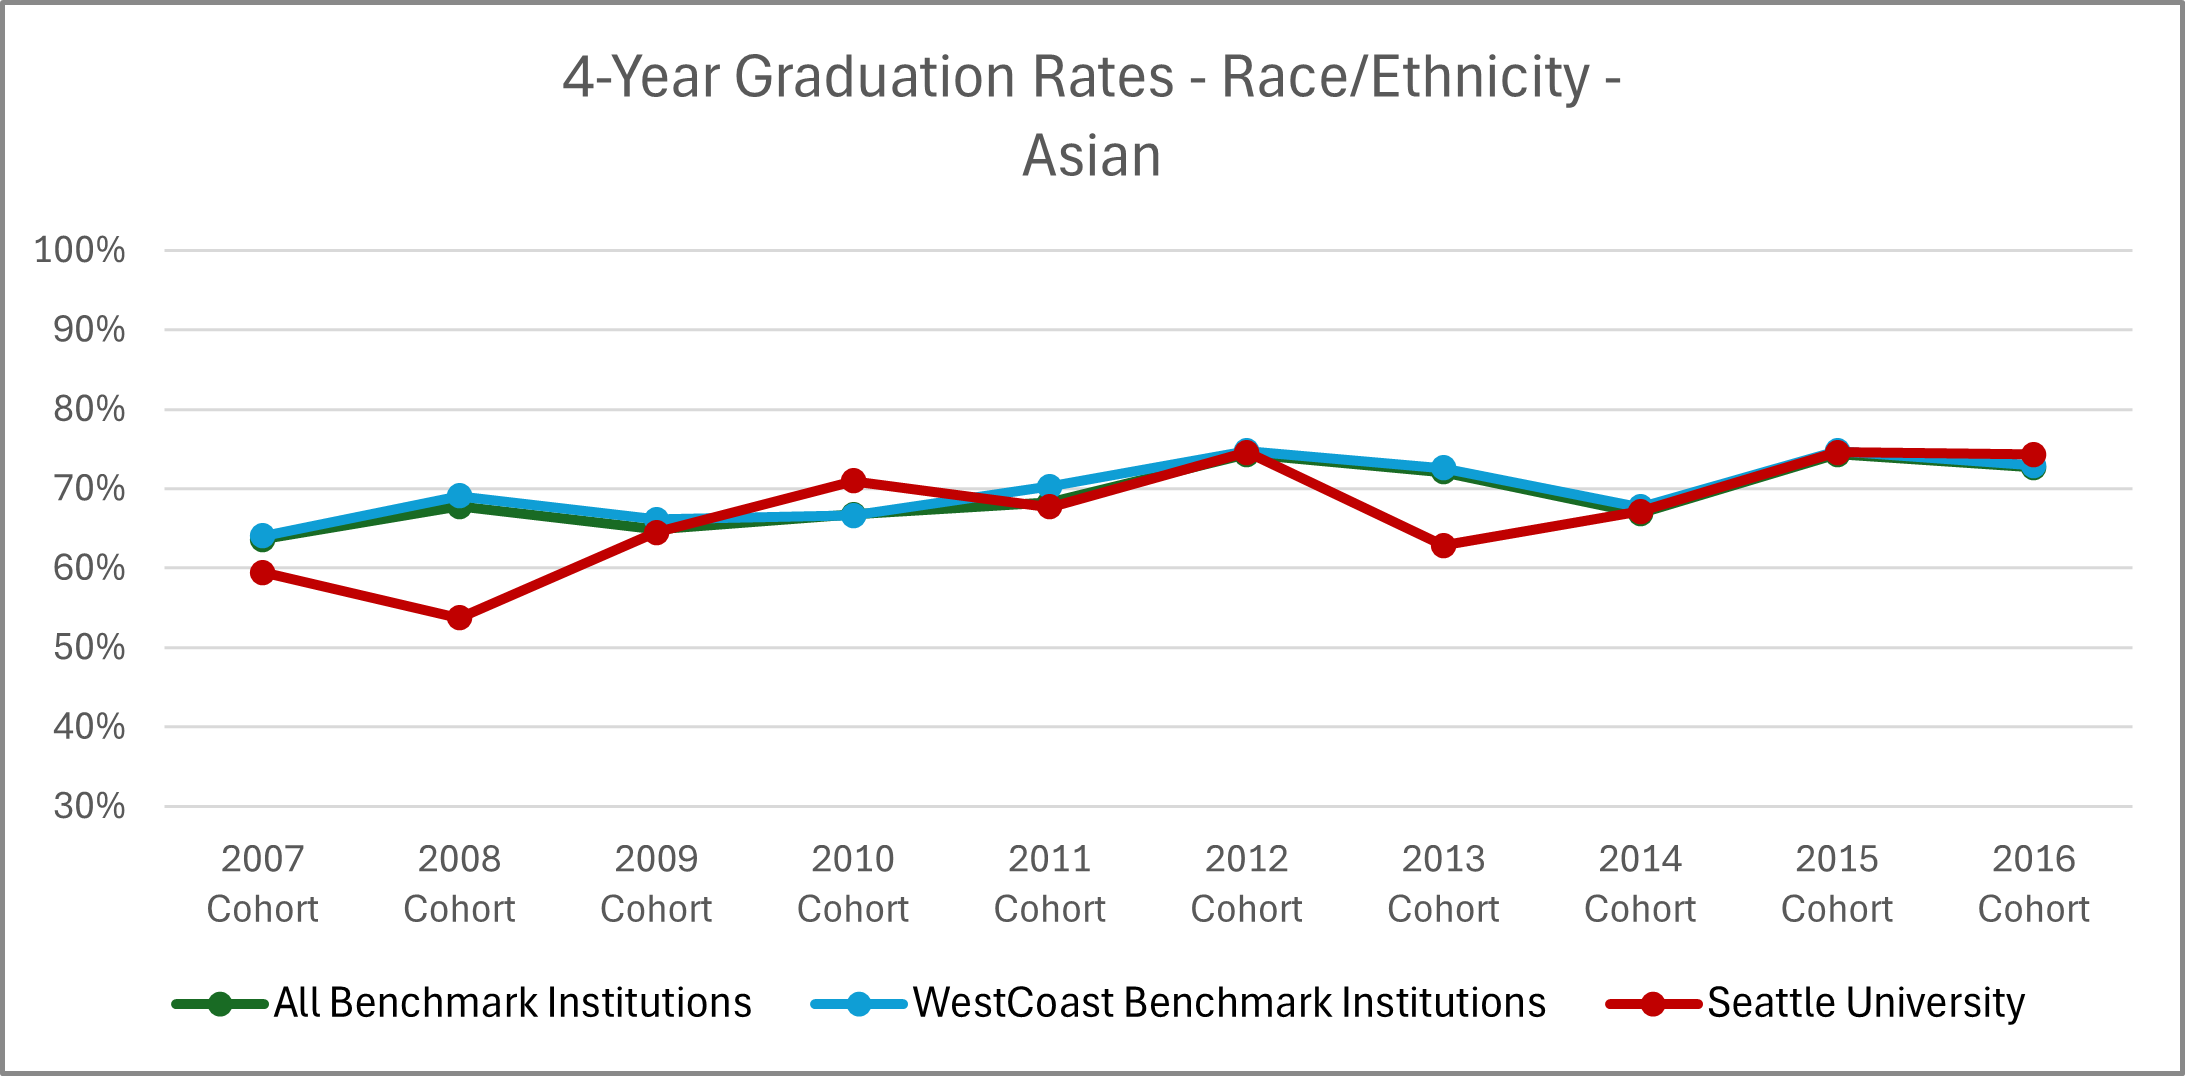
| Cohort | All Benchmark Institutions | WestCoast Benchmark Institutions | Seattle University |
|---|---|---|---|
| 2007 | 64% | 64% | 59% |
| 2008 | 68% | 69% | 54% |
| 2009 | 65% | 66% | 64% |
| 2010 | 67% | 67% | 71% |
| 2011 | 68% | 70% | 68% |
| 2012 | 74% | 75% | 75% |
| 2013 | 72% | 73% | 63% |
| 2014 | 67% | 68% | 67% |
| 2015 | 74% | 75% | 75% |
| 2016 | 73% | 73% | 74% |
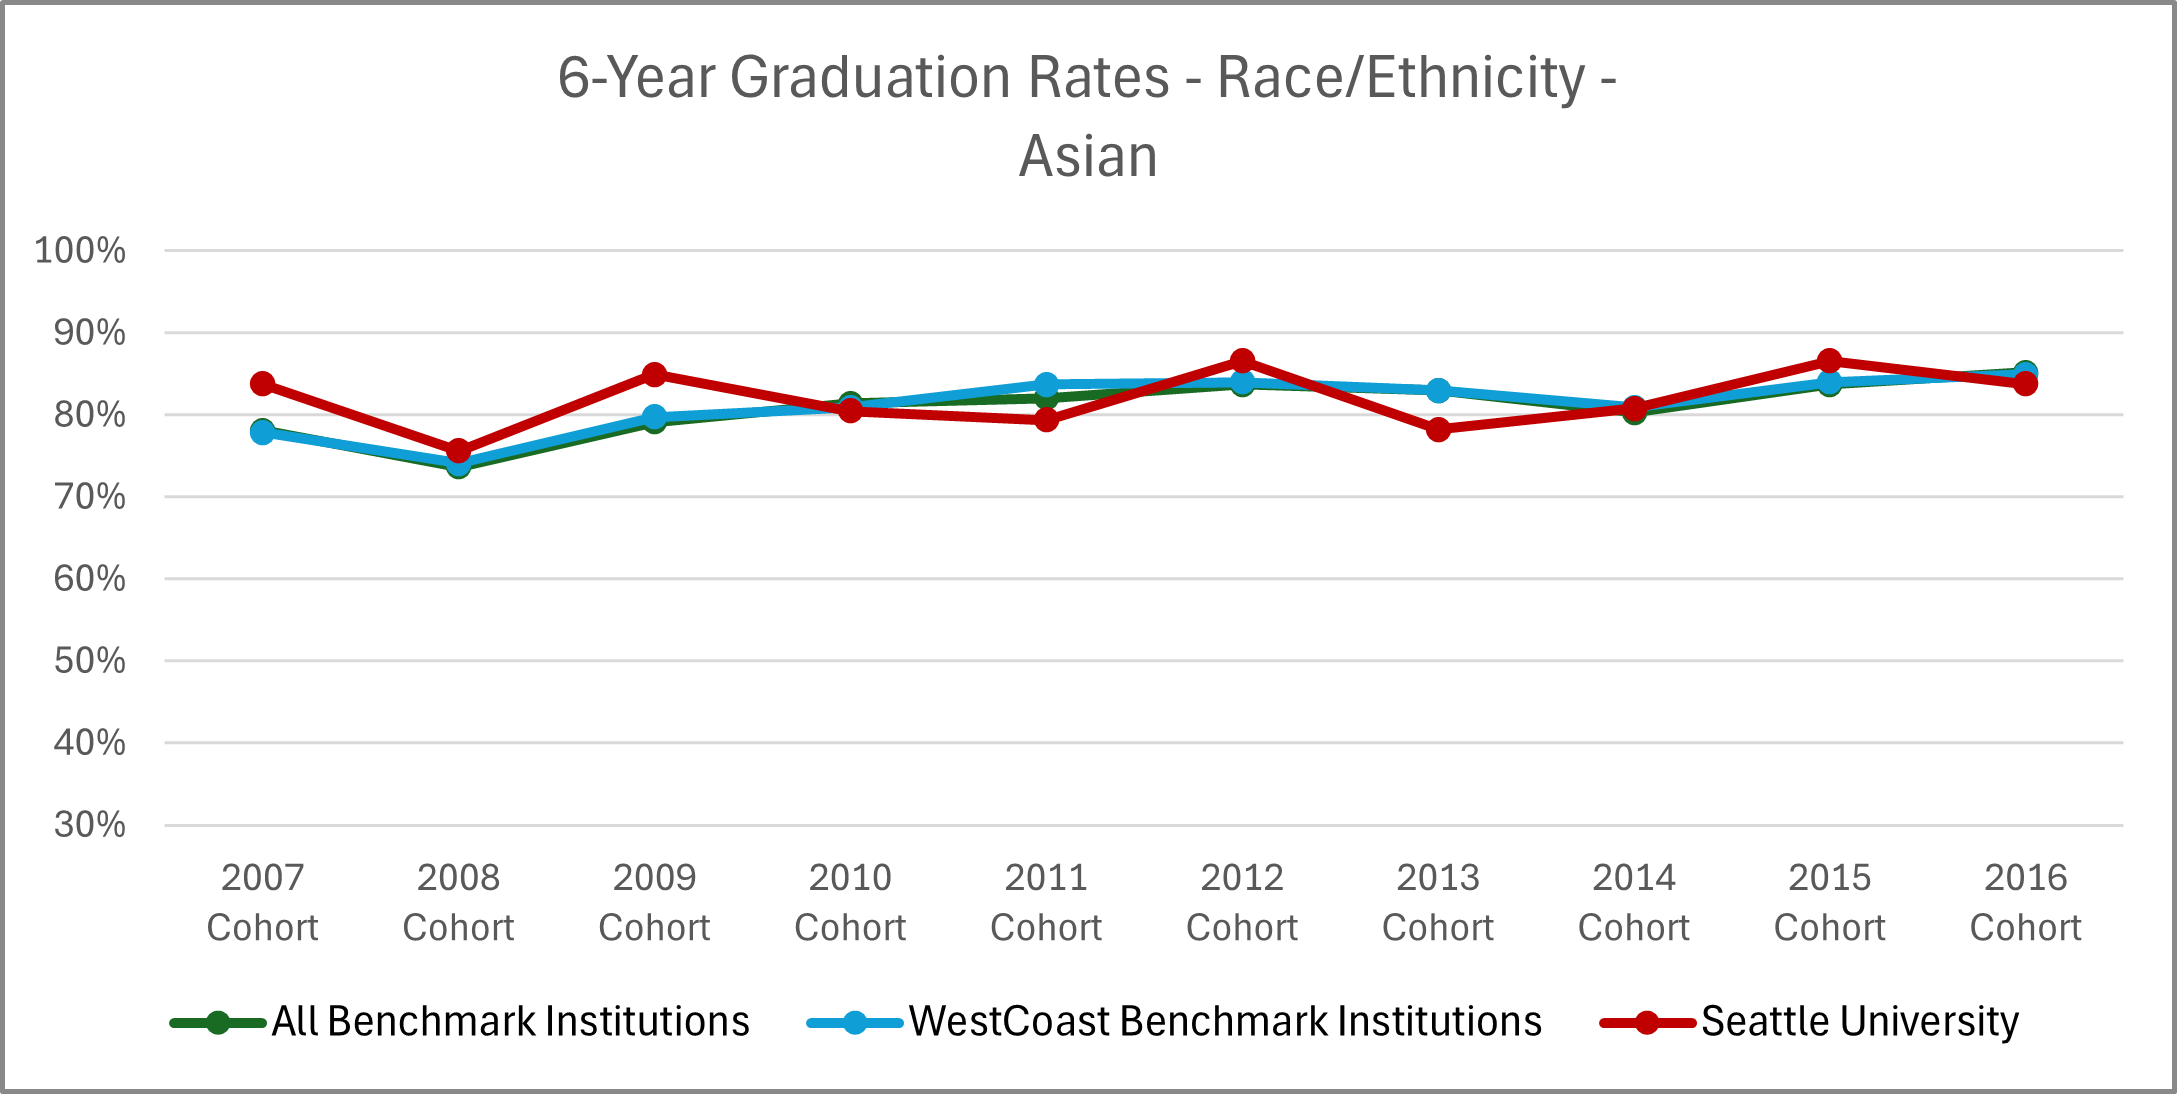
| Cohort | All Benchmark Institutions | WestCoast Benchmark Institutions | Seattle University |
|---|---|---|---|
| 2007 | 78% | 78% | 84% |
| 2008 | 74% | 74% | 76% |
| 2009 | 79% | 80% | 85% |
| 2010 | 81% | 81% | 81% |
| 2011 | 82% | 84% | 79% |
| 2012 | 84% | 84% | 87% |
| 2013 | 83% | 83% | 78% |
| 2014 | 80% | 81% | 81% |
| 2015 | 84% | 84% | 87% |
| 2016 | 85% | 85% | 84% |
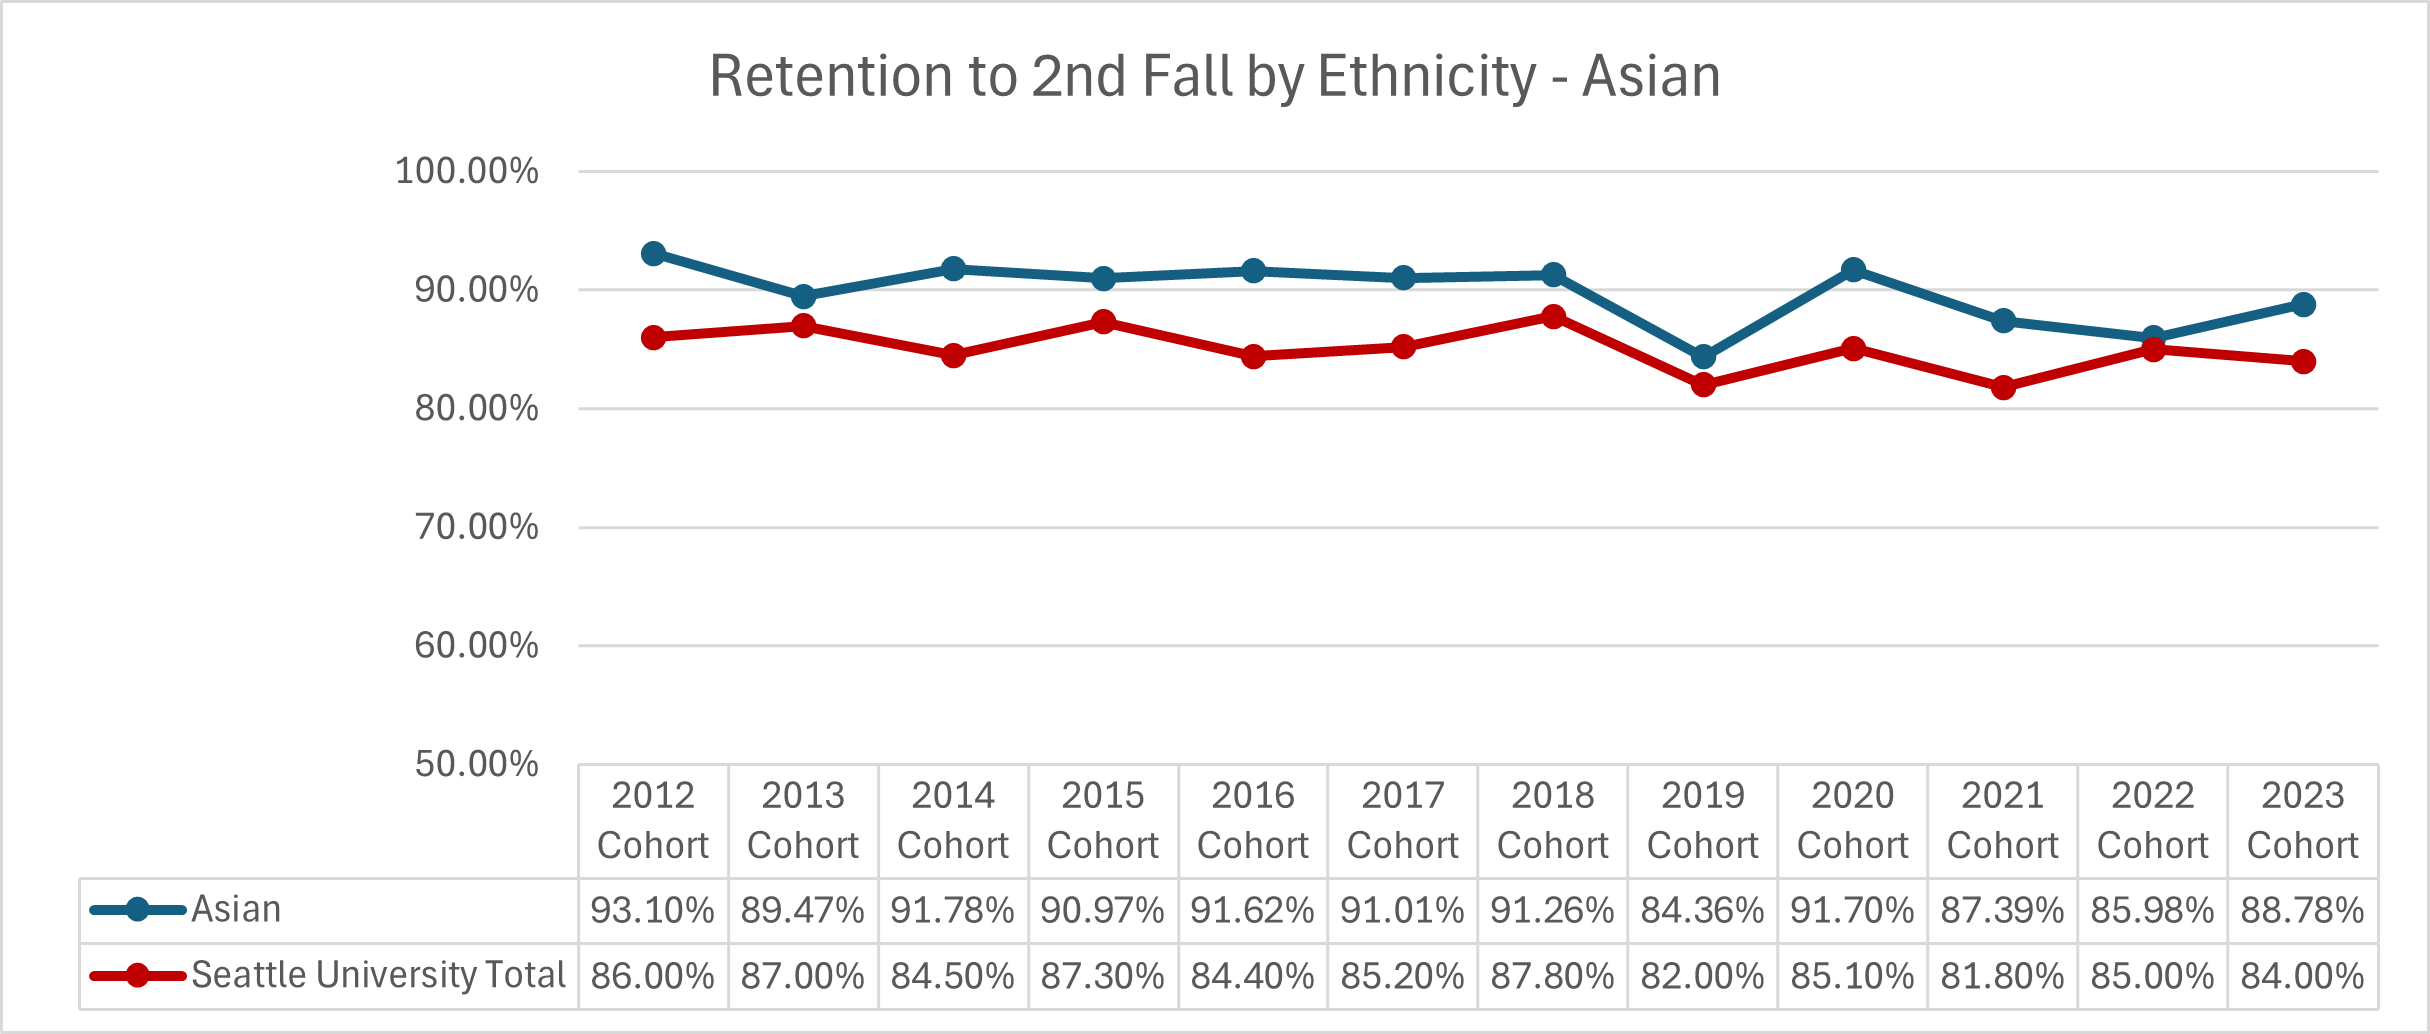
| Cohort Year | Asian | Seattle University Total |
|---|---|---|
| 2012 | 93.10% | 86.00% |
| 2013 | 89.47% | 87.00% |
| 2014 | 91.78% | 84.50% |
| 2015 | 90.97% | 87.30% |
| 2016 | 91.62% | 84.40% |
| 2017 | 91.01% | 85.20% |
| 2018 | 91.26% | 87.80% |
| 2019 | 84.36% | 82.00% |
| 2020 | 91.70% | 85.10% |
| 2021 | 87.39% | 81.80% |
| 2022 | 85.98% | 85.00% |
| 2023 | 88.78% | 84.00% |
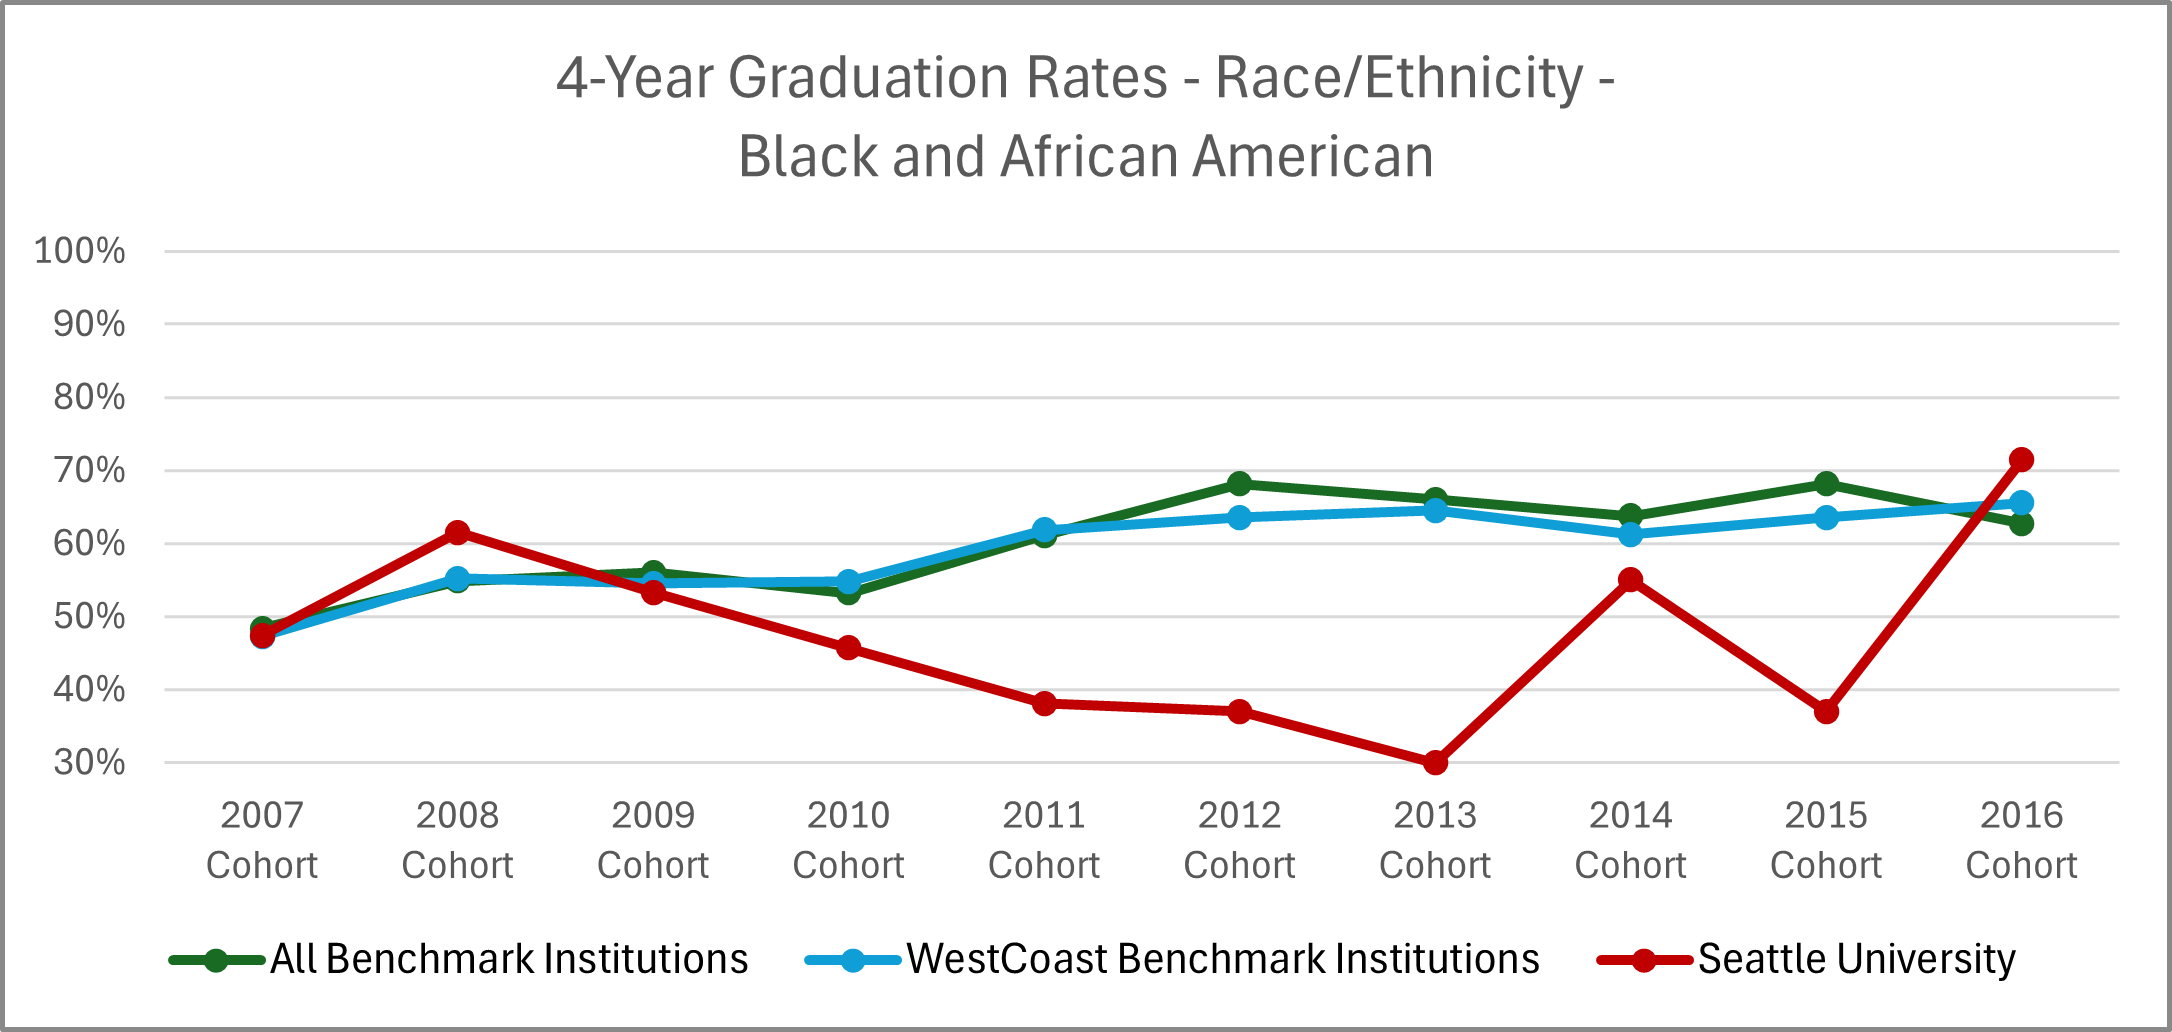
| Cohort | All Benchmark Institutions | WestCoast Benchmark Institutions | Seattle University |
|---|---|---|---|
| 2007 | 48% | 47% | 47% |
| 2008 | 55% | 55% | 62% |
| 2009 | 56% | 55% | 53% |
| 2010 | 53% | 55% | 46% |
| 2011 | 61% | 62% | 38% |
| 2012 | 68% | 64% | 37% |
| 2013 | 66% | 65% | 30% |
| 2014 | 64% | 61% | 55% |
| 2015 | 68% | 64% | 37% |
| 2016 | 63% | 66% | 71% |
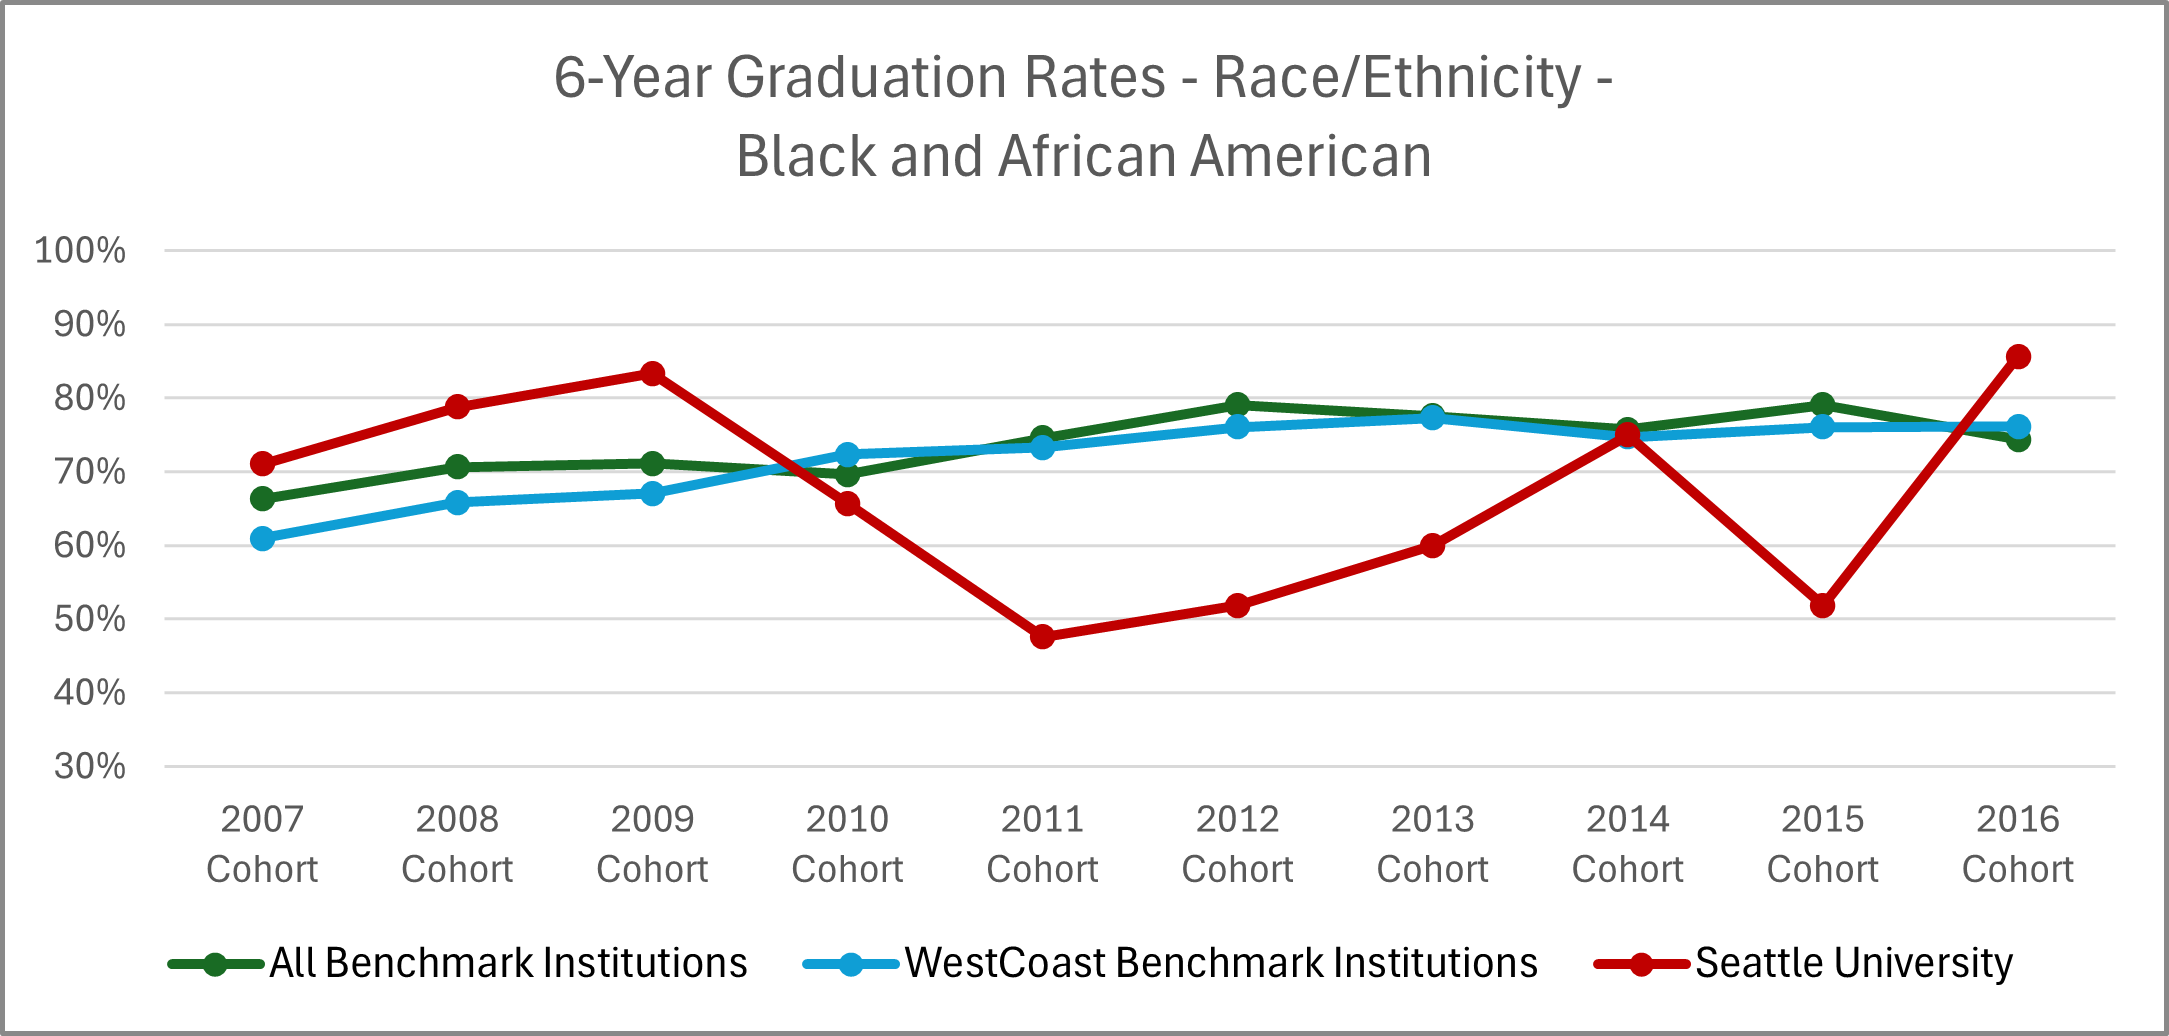
| Cohort | All Benchmark Institutions | WestCoast Benchmark Institutions | Seattle University |
|---|---|---|---|
| 2007 | 66% | 61% | 71% |
| 2008 | 71% | 66% | 79% |
| 2009 | 71% | 67% | 83% |
| 2010 | 70% | 72% | 66% |
| 2011 | 75% | 73% | 48% |
| 2012 | 79% | 76% | 52% |
| 2013 | 78% | 77% | 60% |
| 2014 | 76% | 75% | 75% |
| 2015 | 79% | 76% | 52% |
| 2016 | 74% | 76% | 86% |
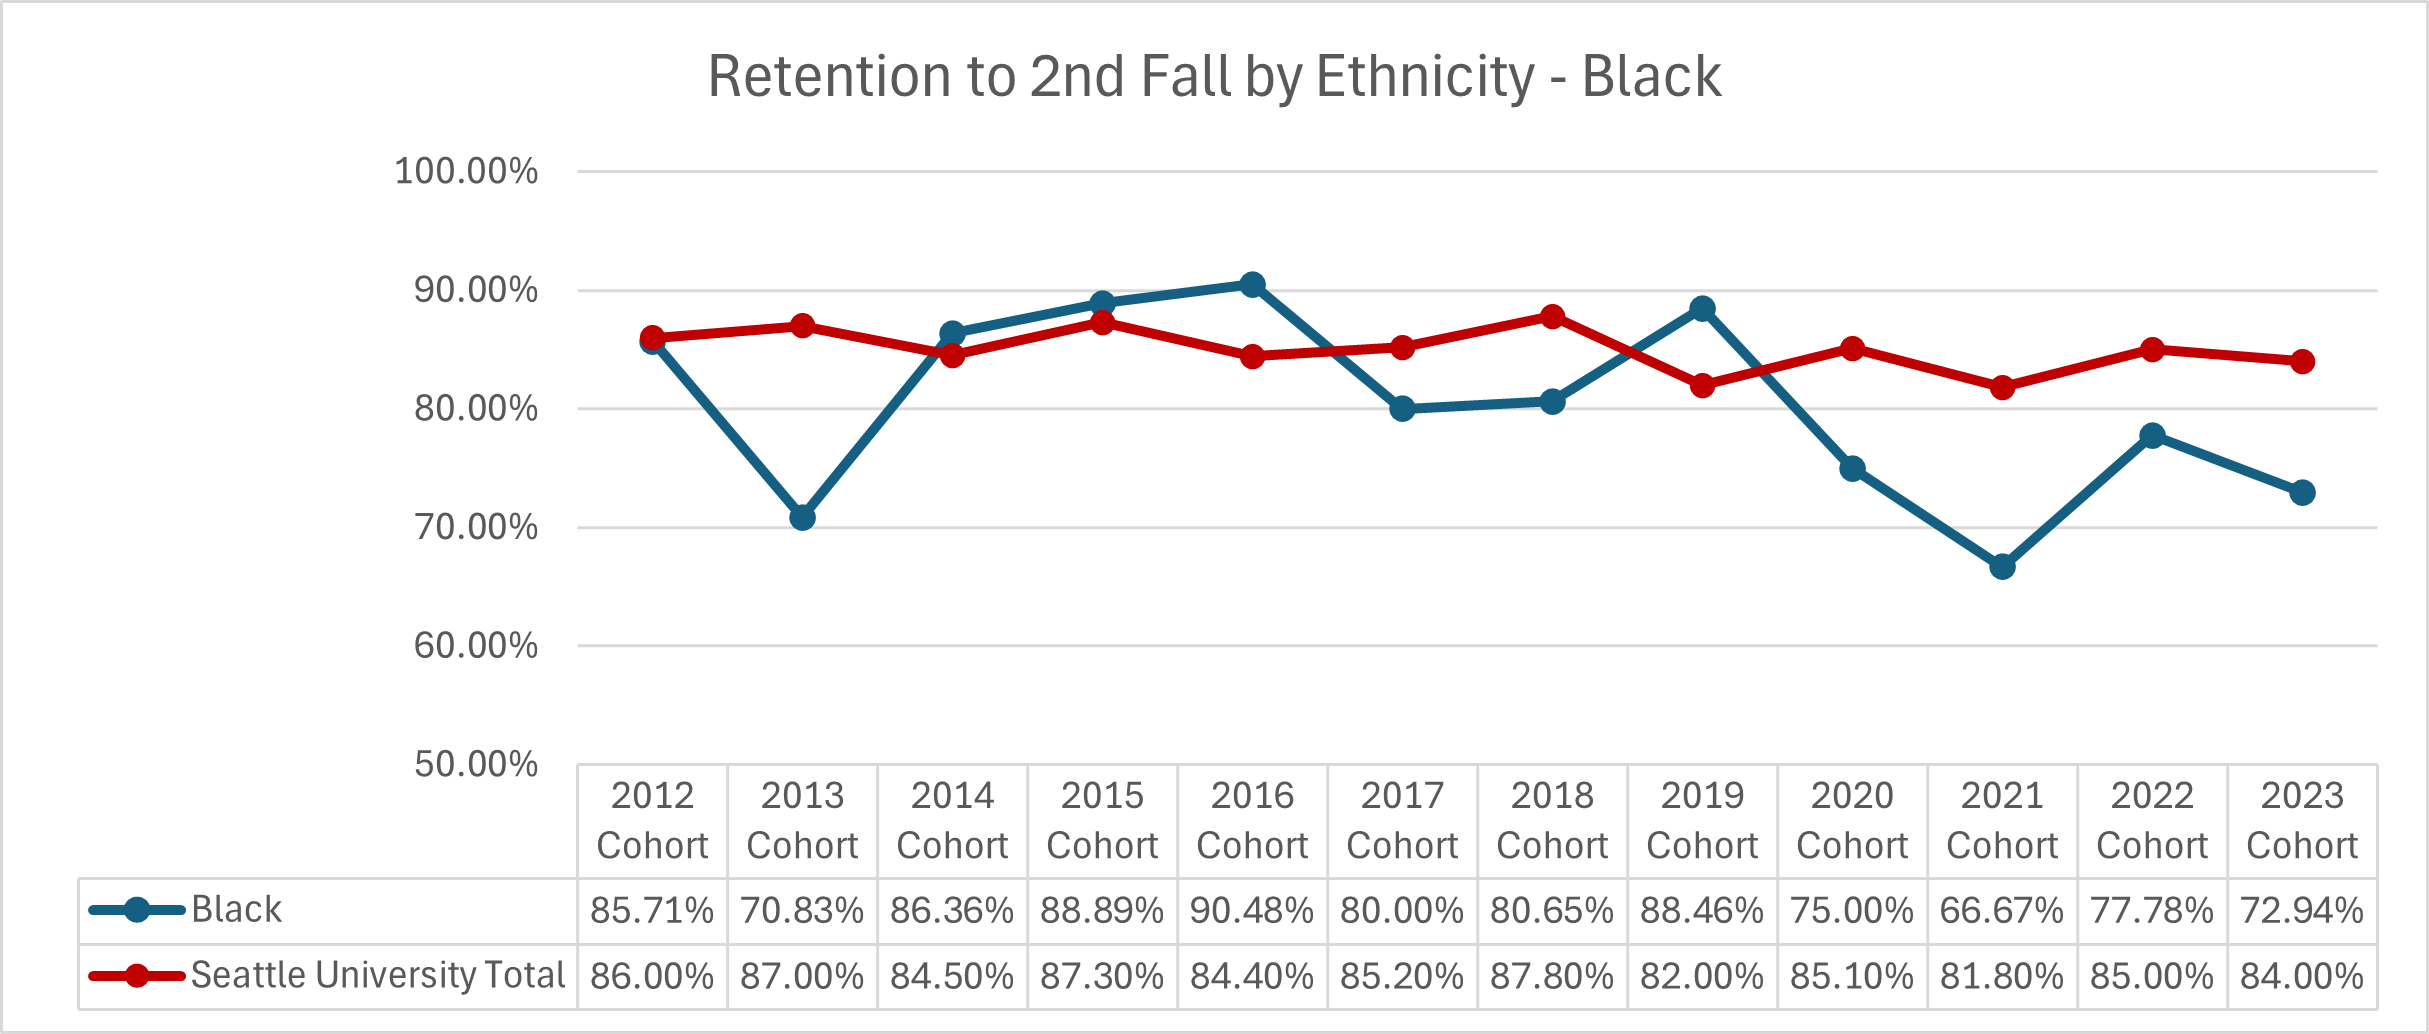
| Cohort Year | Black | Seattle University Total |
|---|---|---|
| 2012 | 85.71% | 86.00% |
| 2013 | 70.83% | 87.00% |
| 2014 | 86.36% | 84.50% |
| 2015 | 88.89% | 87.30% |
| 2016 | 90.48% | 84.40% |
| 2017 | 80.00% | 85.20% |
| 2018 | 80.65% | 87.80% |
| 2019 | 88.46% | 82.00% |
| 2020 | 75.00% | 85.10% |
| 2021 | 66.67% | 81.80% |
| 2022 | 77.78% | 85.00% |
| 2023 | 72.94% | 84.00% |
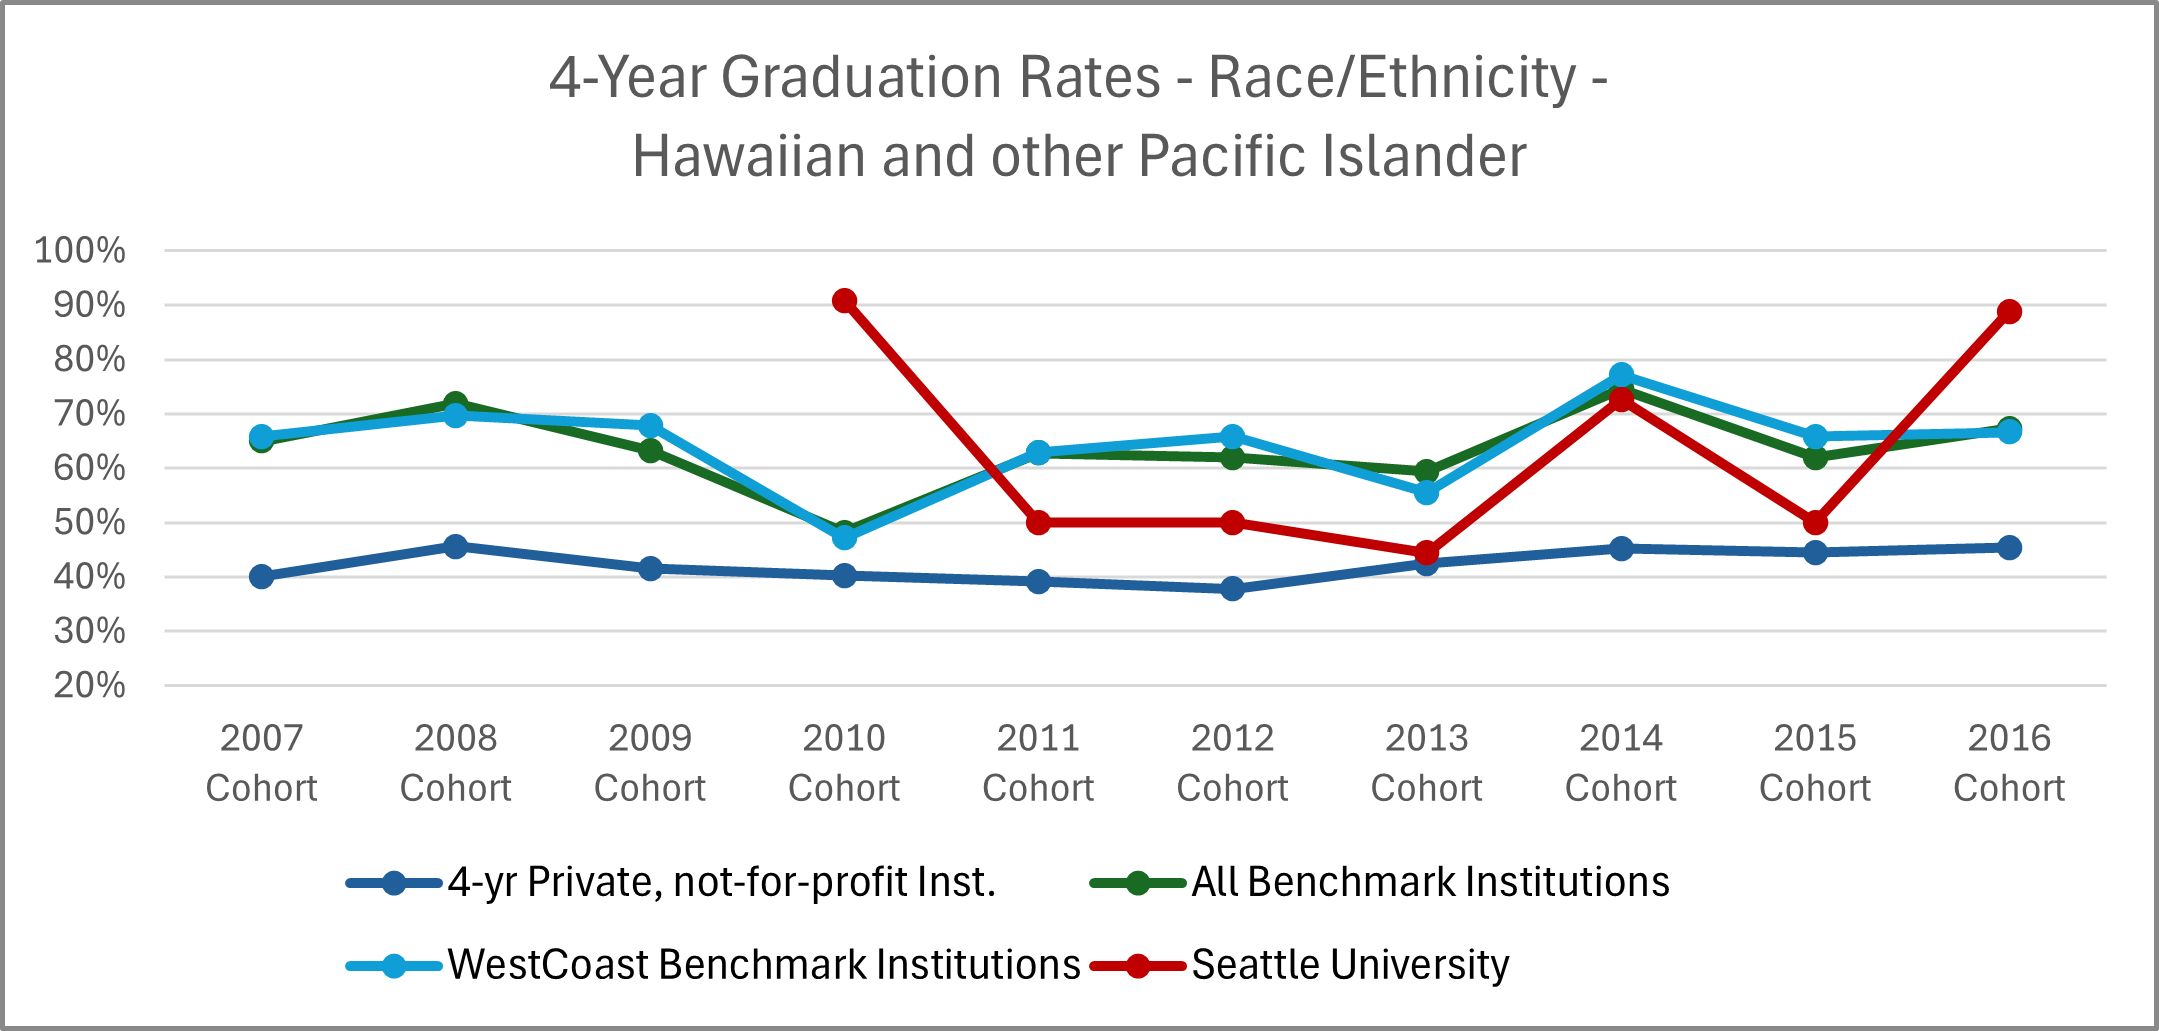
| Cohort | 4-Year Private, Not-for-Profit Institutions | All Benchmark Institutions | WestCoast Benchmark Institutions | Seattle University |
|---|---|---|---|---|
| 2007 | 40% | 65% | 66% | - |
| 2008 | 46% | 72% | 70% | - |
| 2009 | 42% | 63% | 68% | - |
| 2010 | 40% | 48% | 47% | 91% |
| 2011 | 39% | 63% | 63% | 50% |
| 2012 | 38% | 62% | 66% | 50% |
| 2013 | 42% | 59% | 56% | 44% |
| 2014 | 45% | 75% | 77% | 73% |
| 2015 | 45% | 62% | 66% | 50% |
| 2016 | 45% | 67% | 67% | 89% |
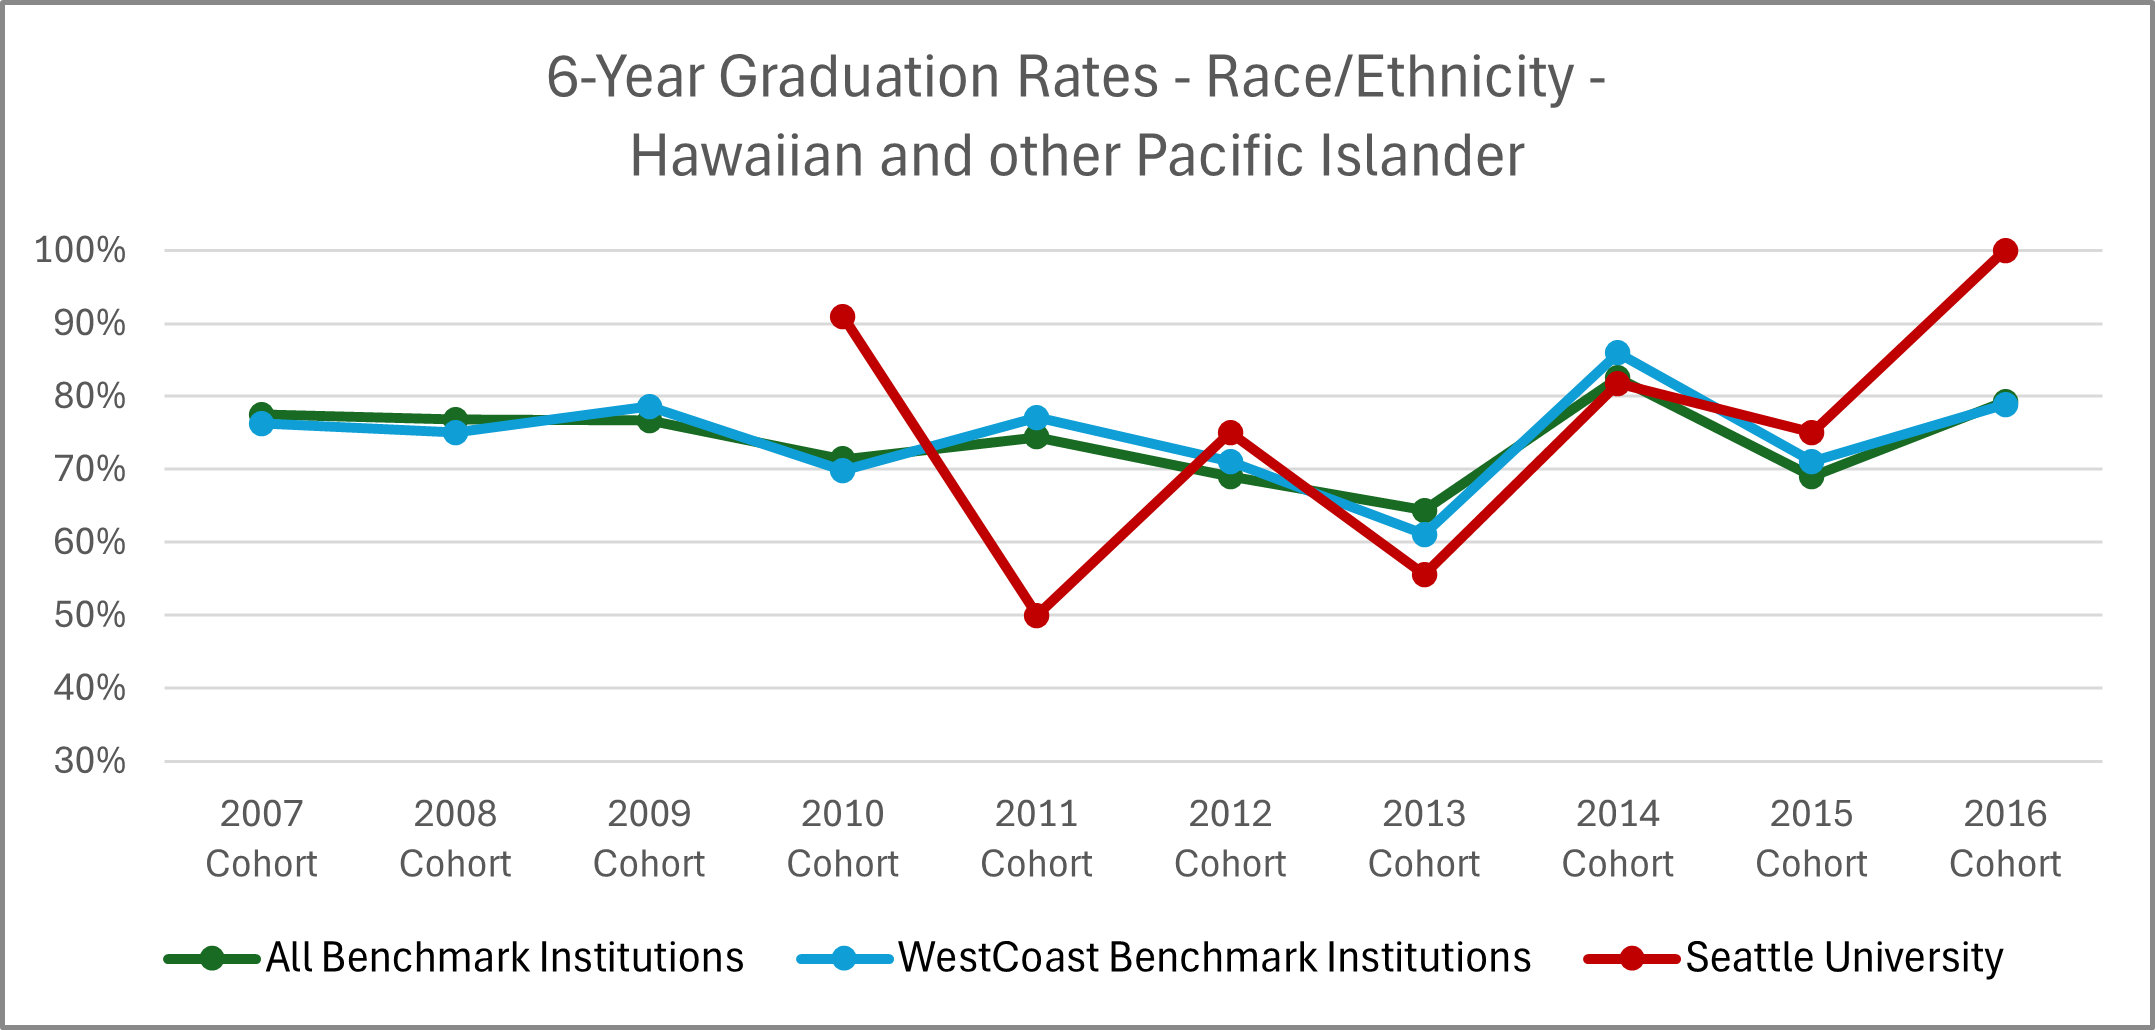
| Cohort | All Benchmark Institutions | WestCoast Benchmark Institutions | Seattle University |
|---|---|---|---|
| 2007 | 78% | 76% | - |
| 2008 | 77% | 75% | - |
| 2009 | 77% | 79% | - |
| 2010 | 71% | 70% | 91% |
| 2011 | 74% | 77% | 50% |
| 2012 | 69% | 71% | 75% |
| 2013 | 64% | 61% | 56% |
| 2014 | 83% | 86% | 82% |
| 2015 | 69% | 71% | 75% |
| 2016 | 79% | 79% | 100% |
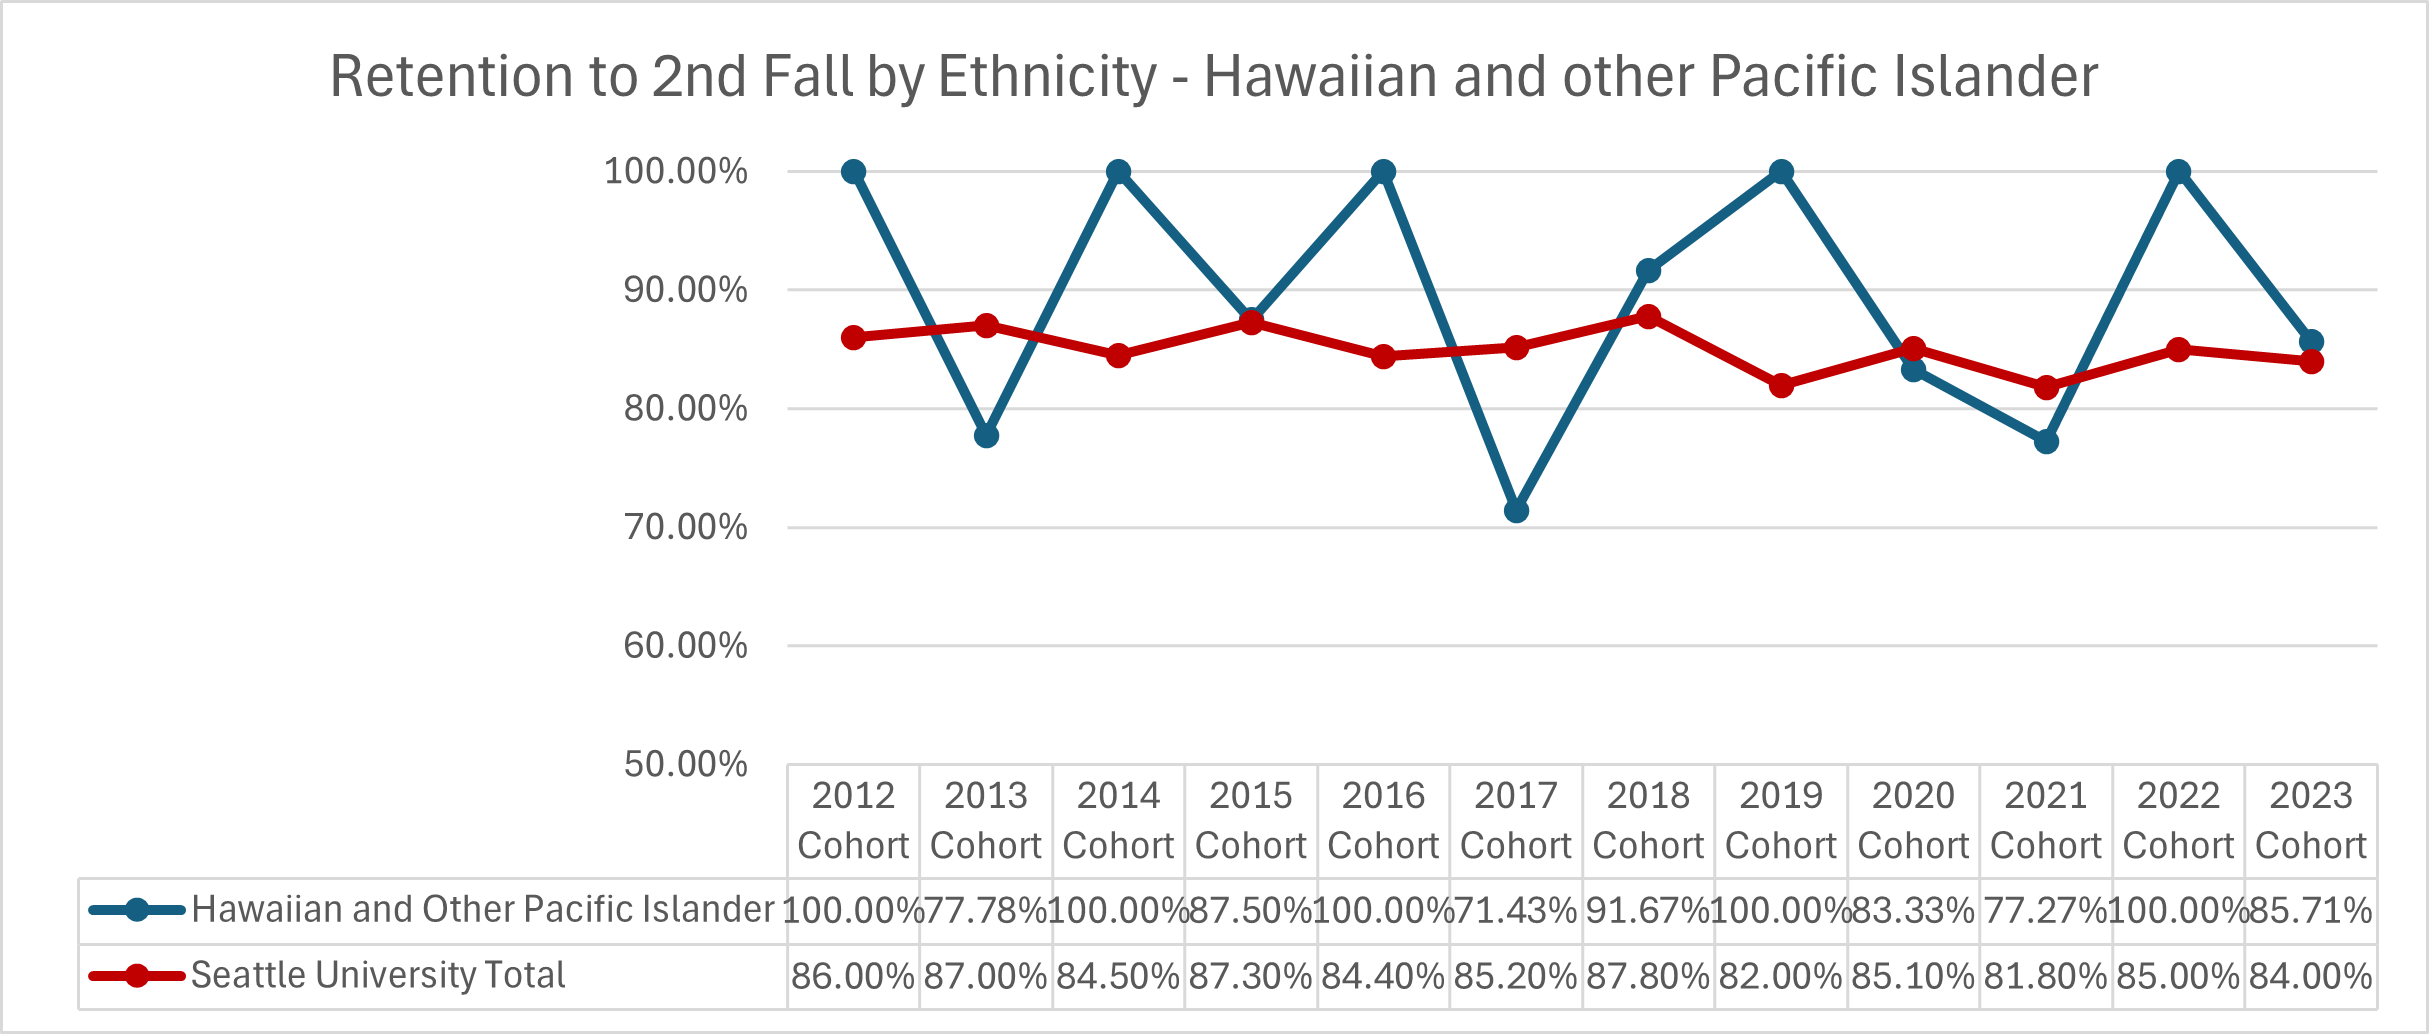
| Cohort Year | Hawaiian and Other Pacific Islander | Seattle University Total |
|---|---|---|
| 2012 | 100.00% | 86.00% |
| 2013 | 77.78% | 87.00% |
| 2014 | 100.00% | 84.50% |
| 2015 | 87.50% | 87.30% |
| 2016 | 100.00% | 84.40% |
| 2017 | 71.43% | 85.20% |
| 2018 | 91.67% | 87.80% |
| 2019 | 100.00% | 82.00% |
| 2020 | 83.33% | 85.10% |
| 2021 | 77.27% | 81.80% |
| 2022 | 100.00% | 85.00% |
| 2023 | 85.71% | 84.00% |
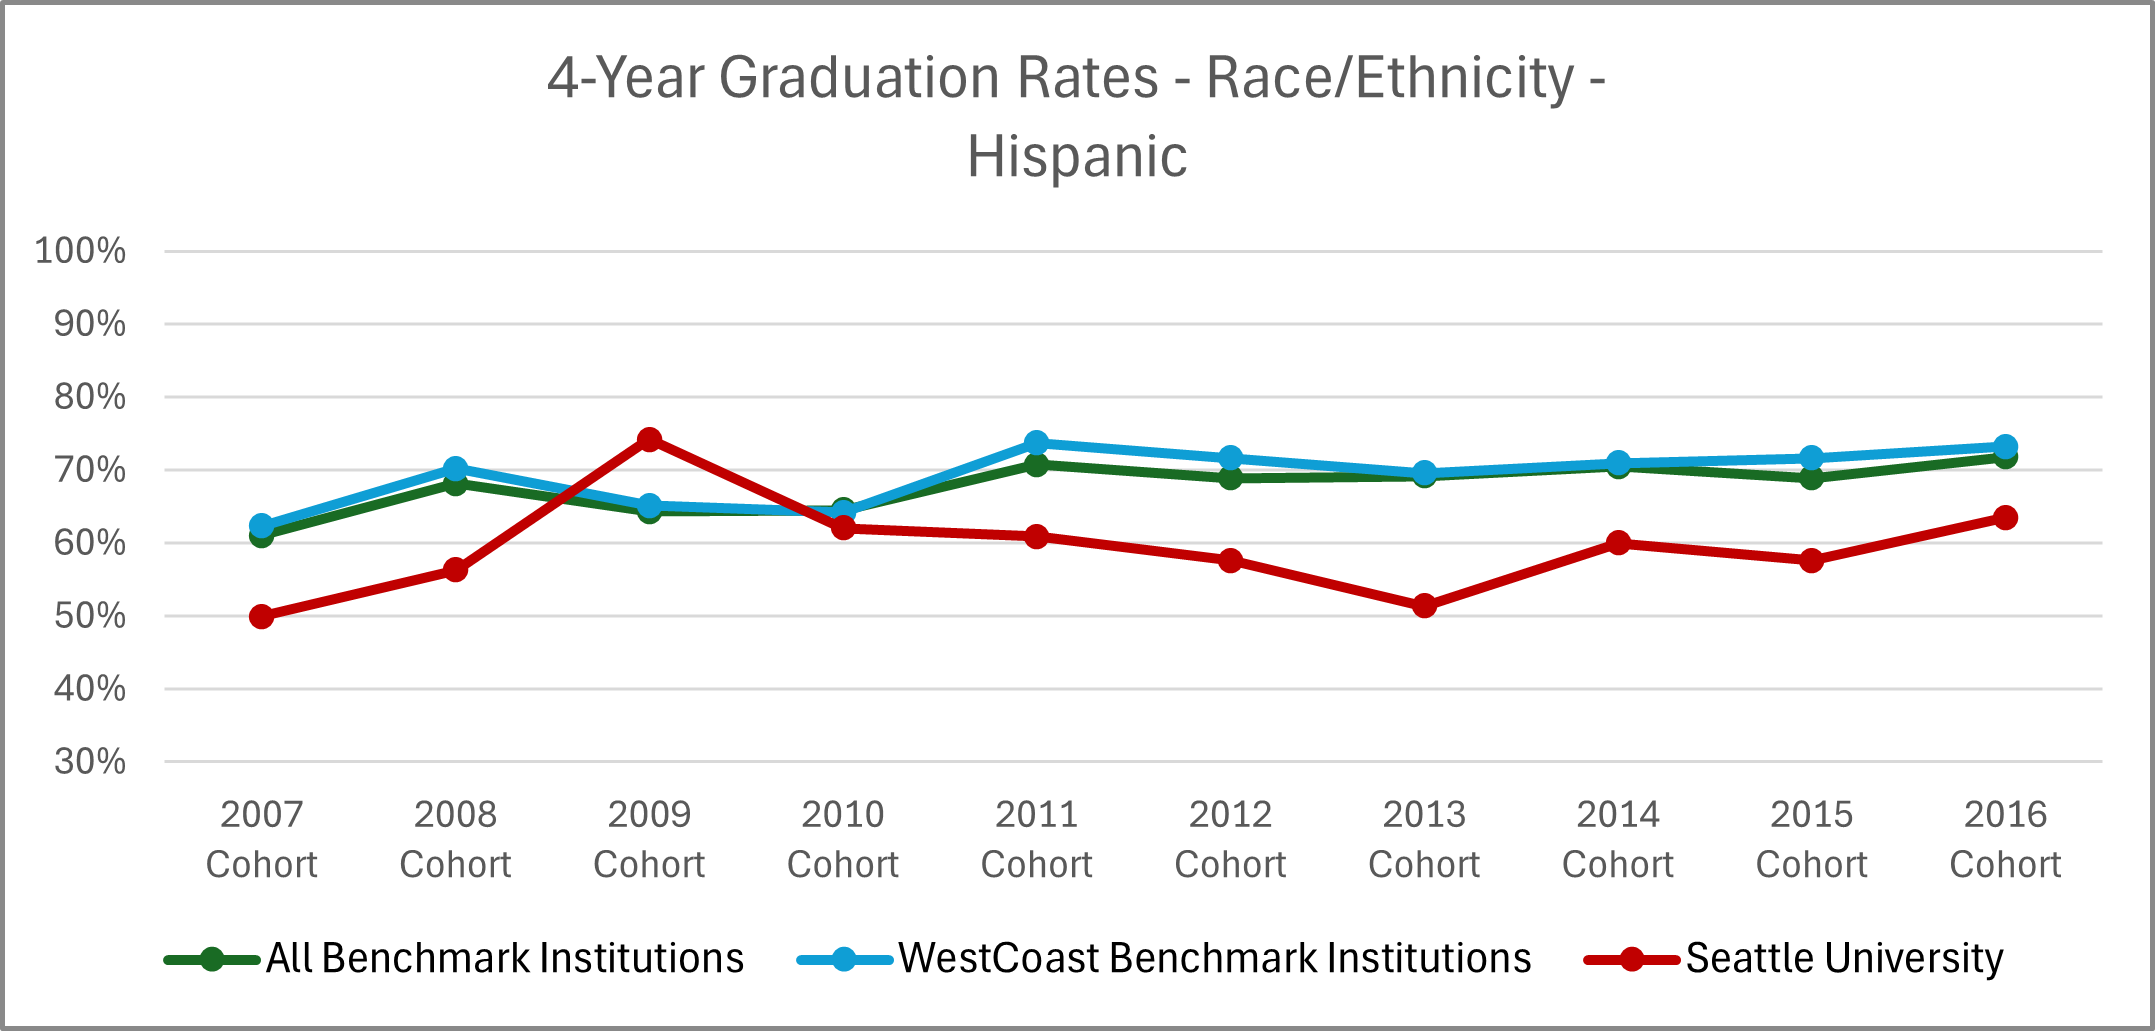
| Cohort Year | All Benchmark Institutions | WestCoast Benchmark Institutions | Seattle University |
|---|---|---|---|
| 2007 | 61% | 62% | 50% |
| 2008 | 68% | 70% | 56% |
| 2009 | 64% | 65% | 74% |
| 2010 | 65% | 64% | 62% |
| 2011 | 71% | 74% | 61% |
| 2012 | 69% | 72% | 58% |
| 2013 | 69% | 70% | 51% |
| 2014 | 71% | 71% | 60% |
| 2015 | 69% | 72% | 58% |
| 2016 | 72% | 73% | 64% |
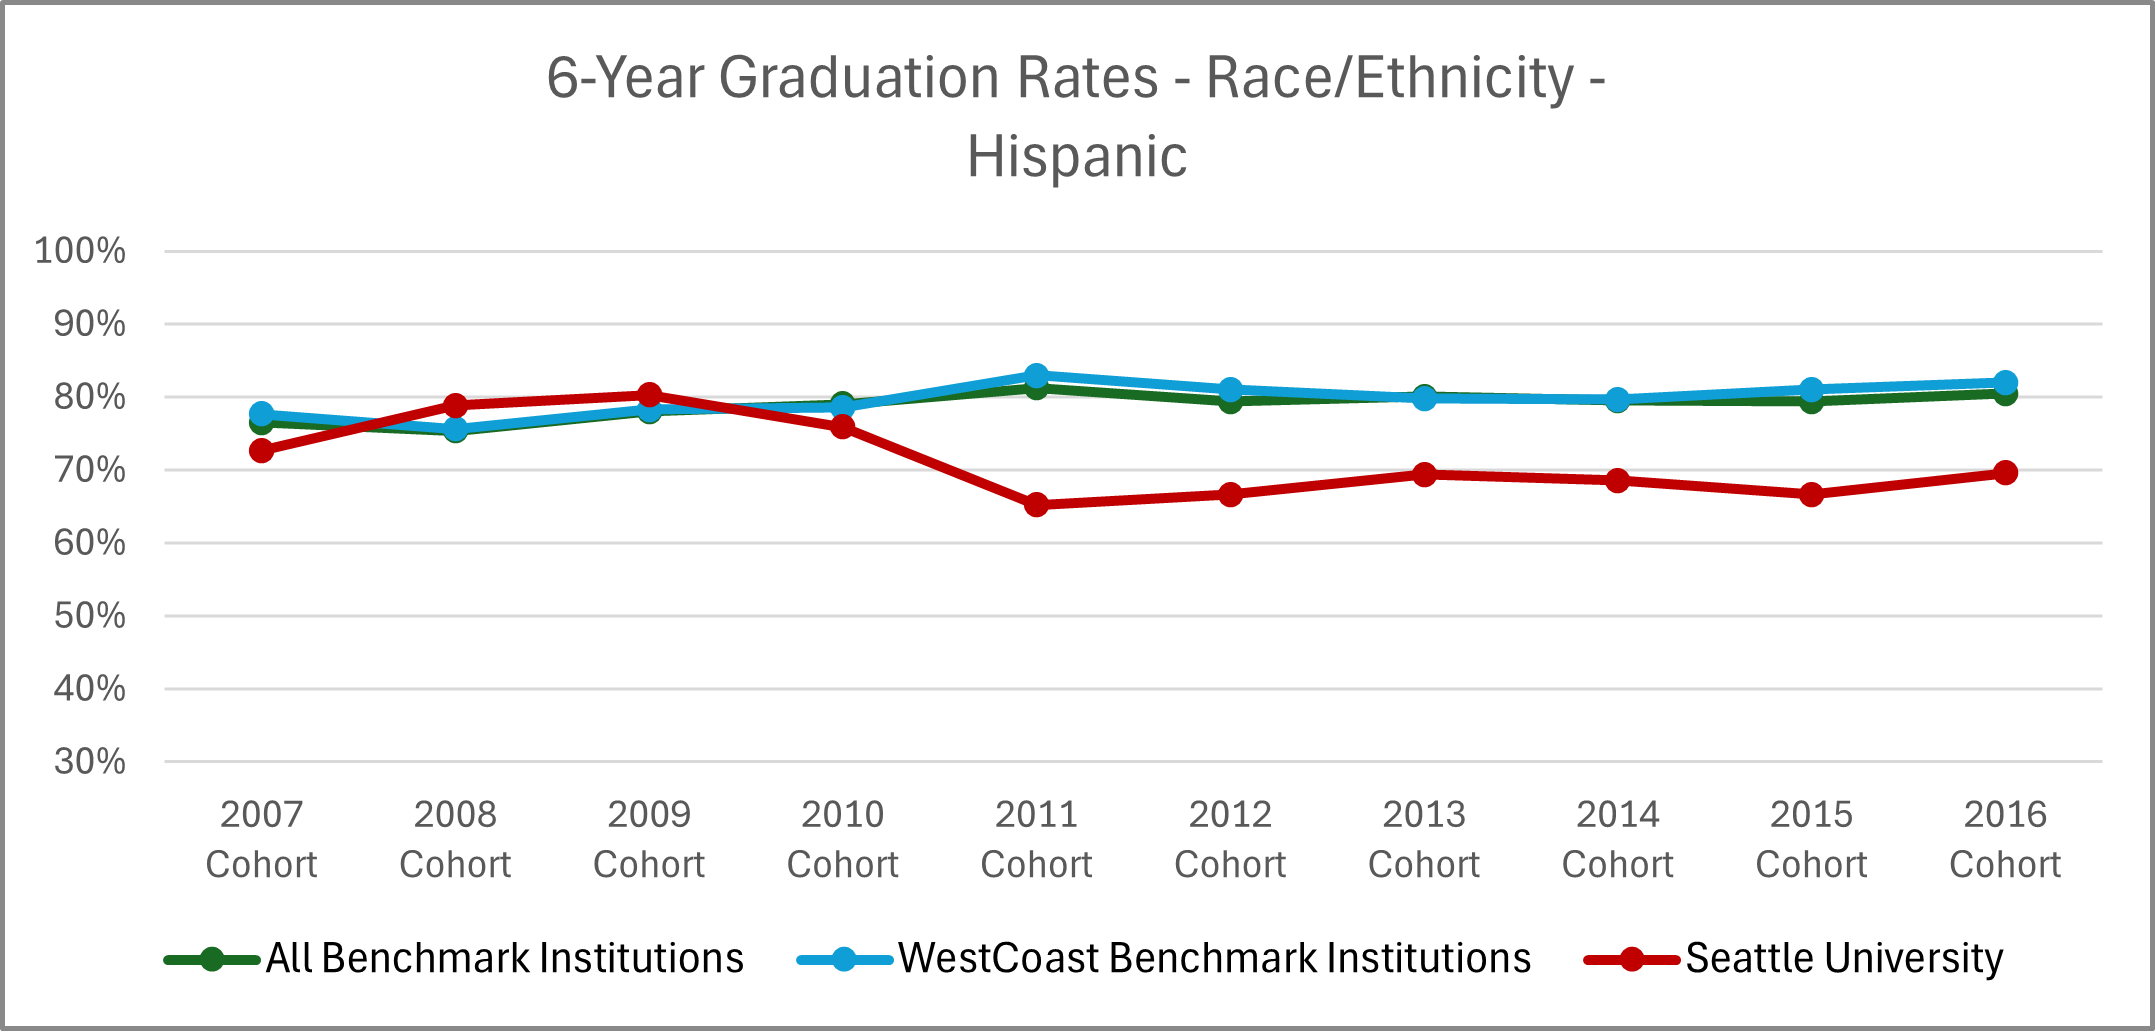
| Cohort Year | All Benchmark Institutions | WestCoast Benchmark Institutions | Seattle University |
|---|---|---|---|
| 2007 | 76% | 78% | 73% |
| 2008 | 75% | 76% | 79% |
| 2009 | 78% | 78% | 80% |
| 2010 | 79% | 79% | 76% |
| 2011 | 81% | 83% | 65% |
| 2012 | 79% | 81% | 67% |
| 2013 | 80% | 80% | 69% |
| 2014 | 80% | 80% | 69% |
| 2015 | 79% | 81% | 67% |
| 2016 | 81% | 82% | 70% |
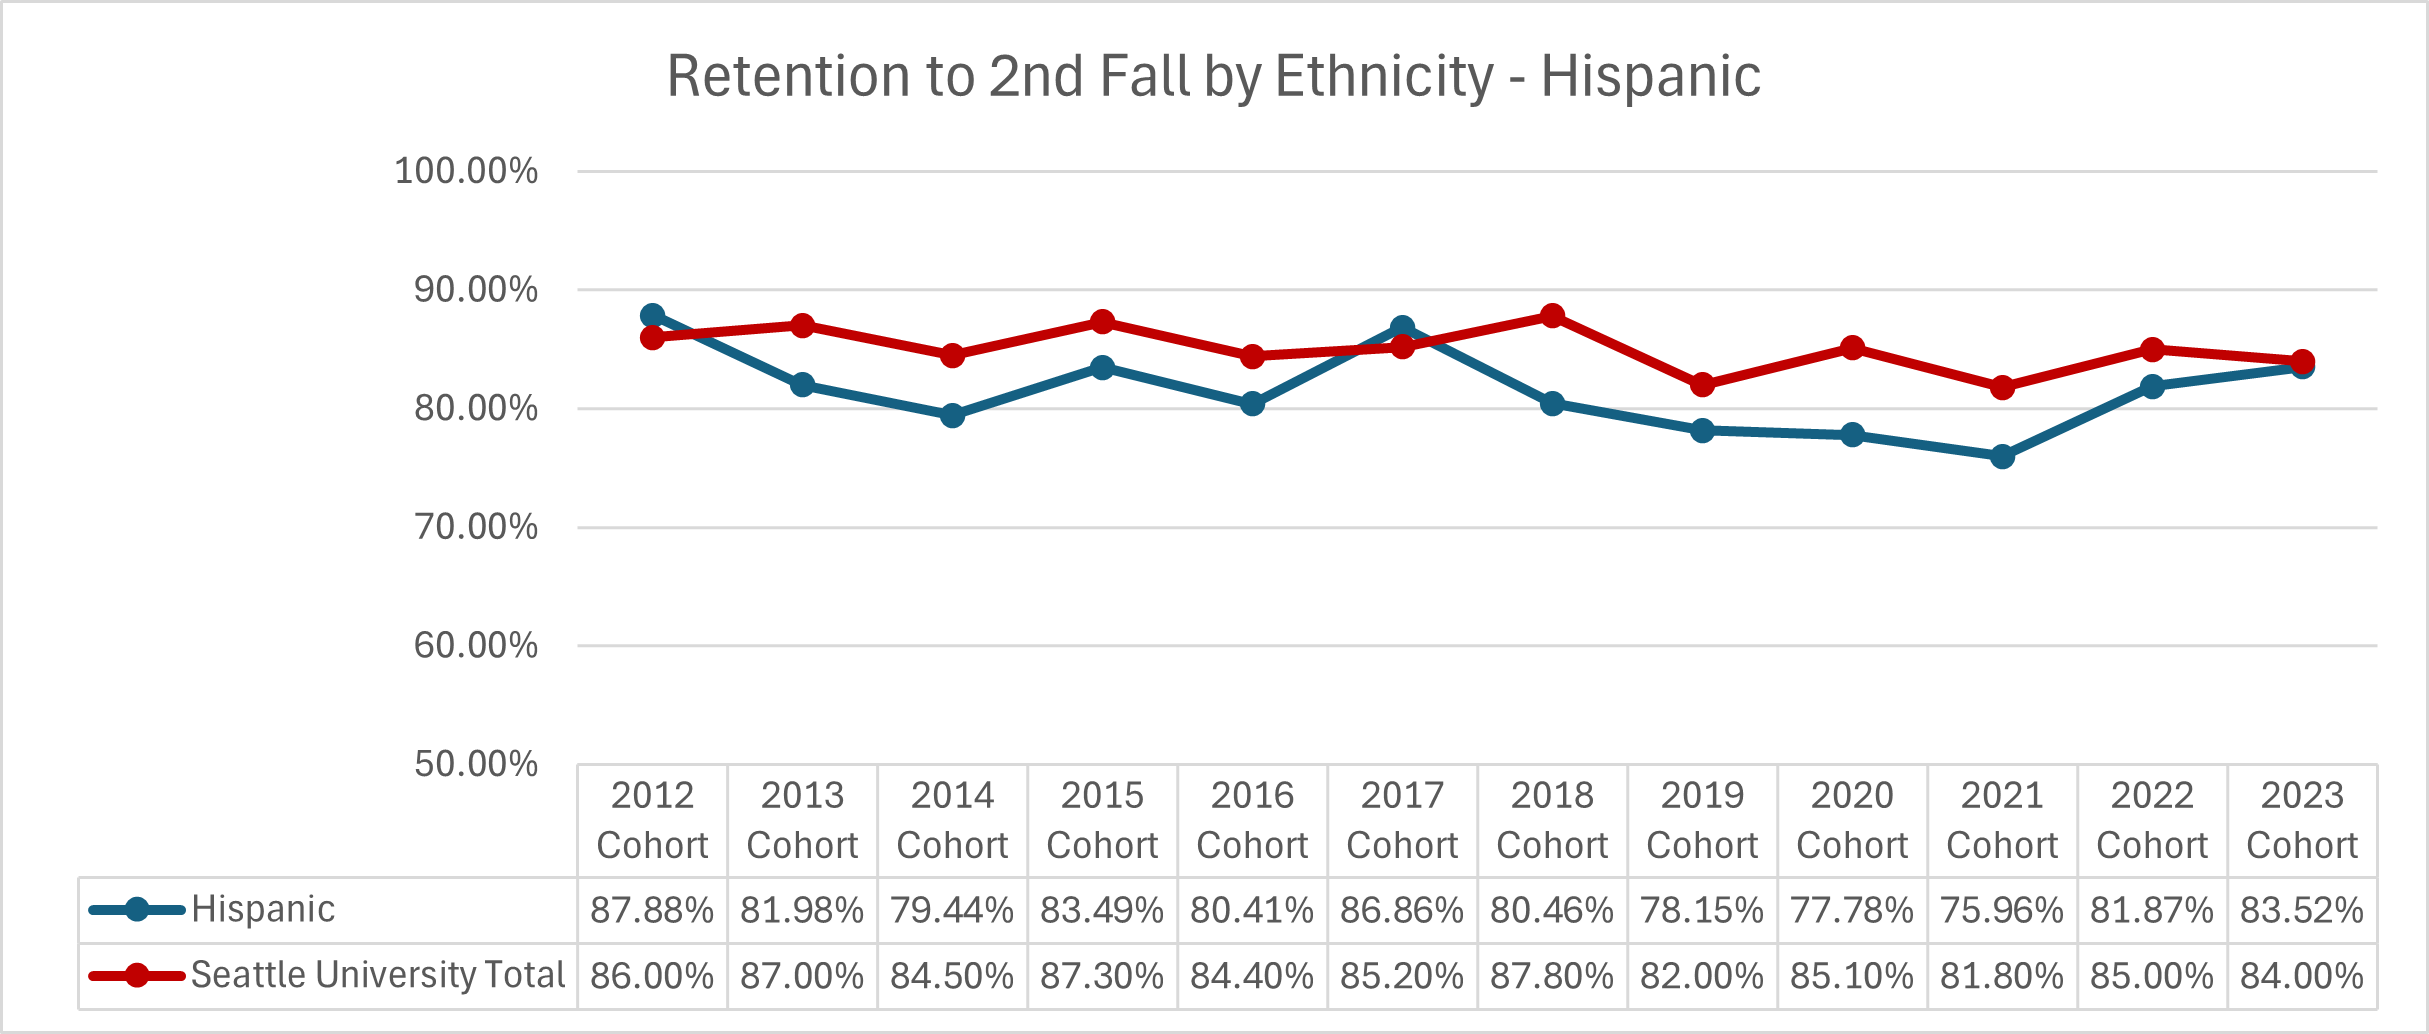
| Cohort Year | Hispanic | Seattle University Total |
|---|---|---|
| 2012 | 87.88% | 86.00% |
| 2013 | 81.98% | 87.00% |
| 2014 | 79.44% | 84.50% |
| 2015 | 83.49% | 87.30% |
| 2016 | 80.41% | 84.40% |
| 2017 | 86.86% | 85.20% |
| 2018 | 80.46% | 87.80% |
| 2019 | 78.15% | 82.00% |
| 2020 | 77.78% | 85.10% |
| 2021 | 75.96% | 81.80% |
| 2022 | 81.87% | 85.00% |
| 2023 | 83.52% | 84.00% |
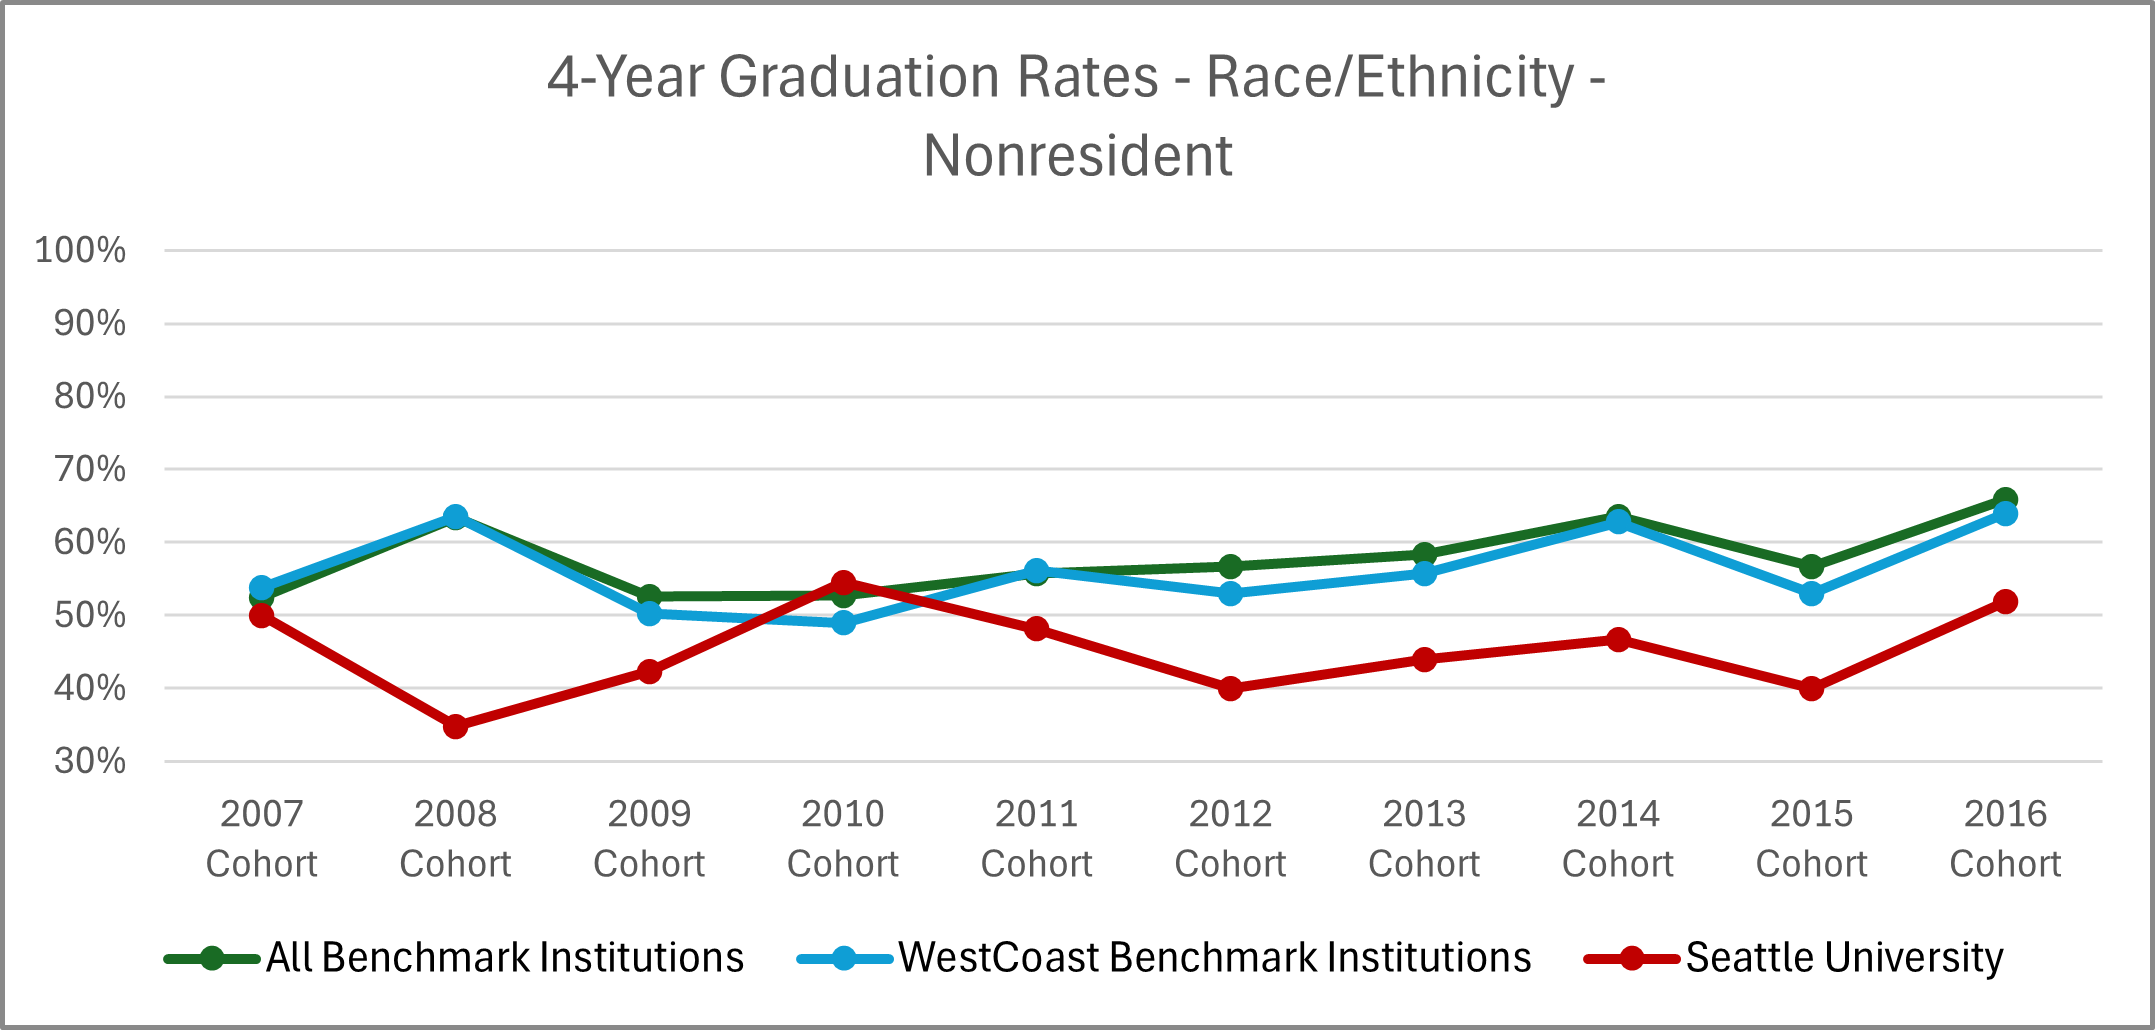
| Cohort Year | All Benchmark Institutions | WestCoast Benchmark Institutions | Seattle University |
|---|---|---|---|
| 2007 | 52% | 54% | 50% |
| 2008 | 63% | 64% | 35% |
| 2009 | 53% | 50% | 42% |
| 2010 | 53% | 49% | 55% |
| 2011 | 56% | 56% | 48% |
| 2012 | 57% | 53% | 40% |
| 2013 | 58% | 56% | 44% |
| 2014 | 64% | 63% | 47% |
| 2015 | 57% | 53% | 40% |
| 2016 | 66% | 64% | 52% |
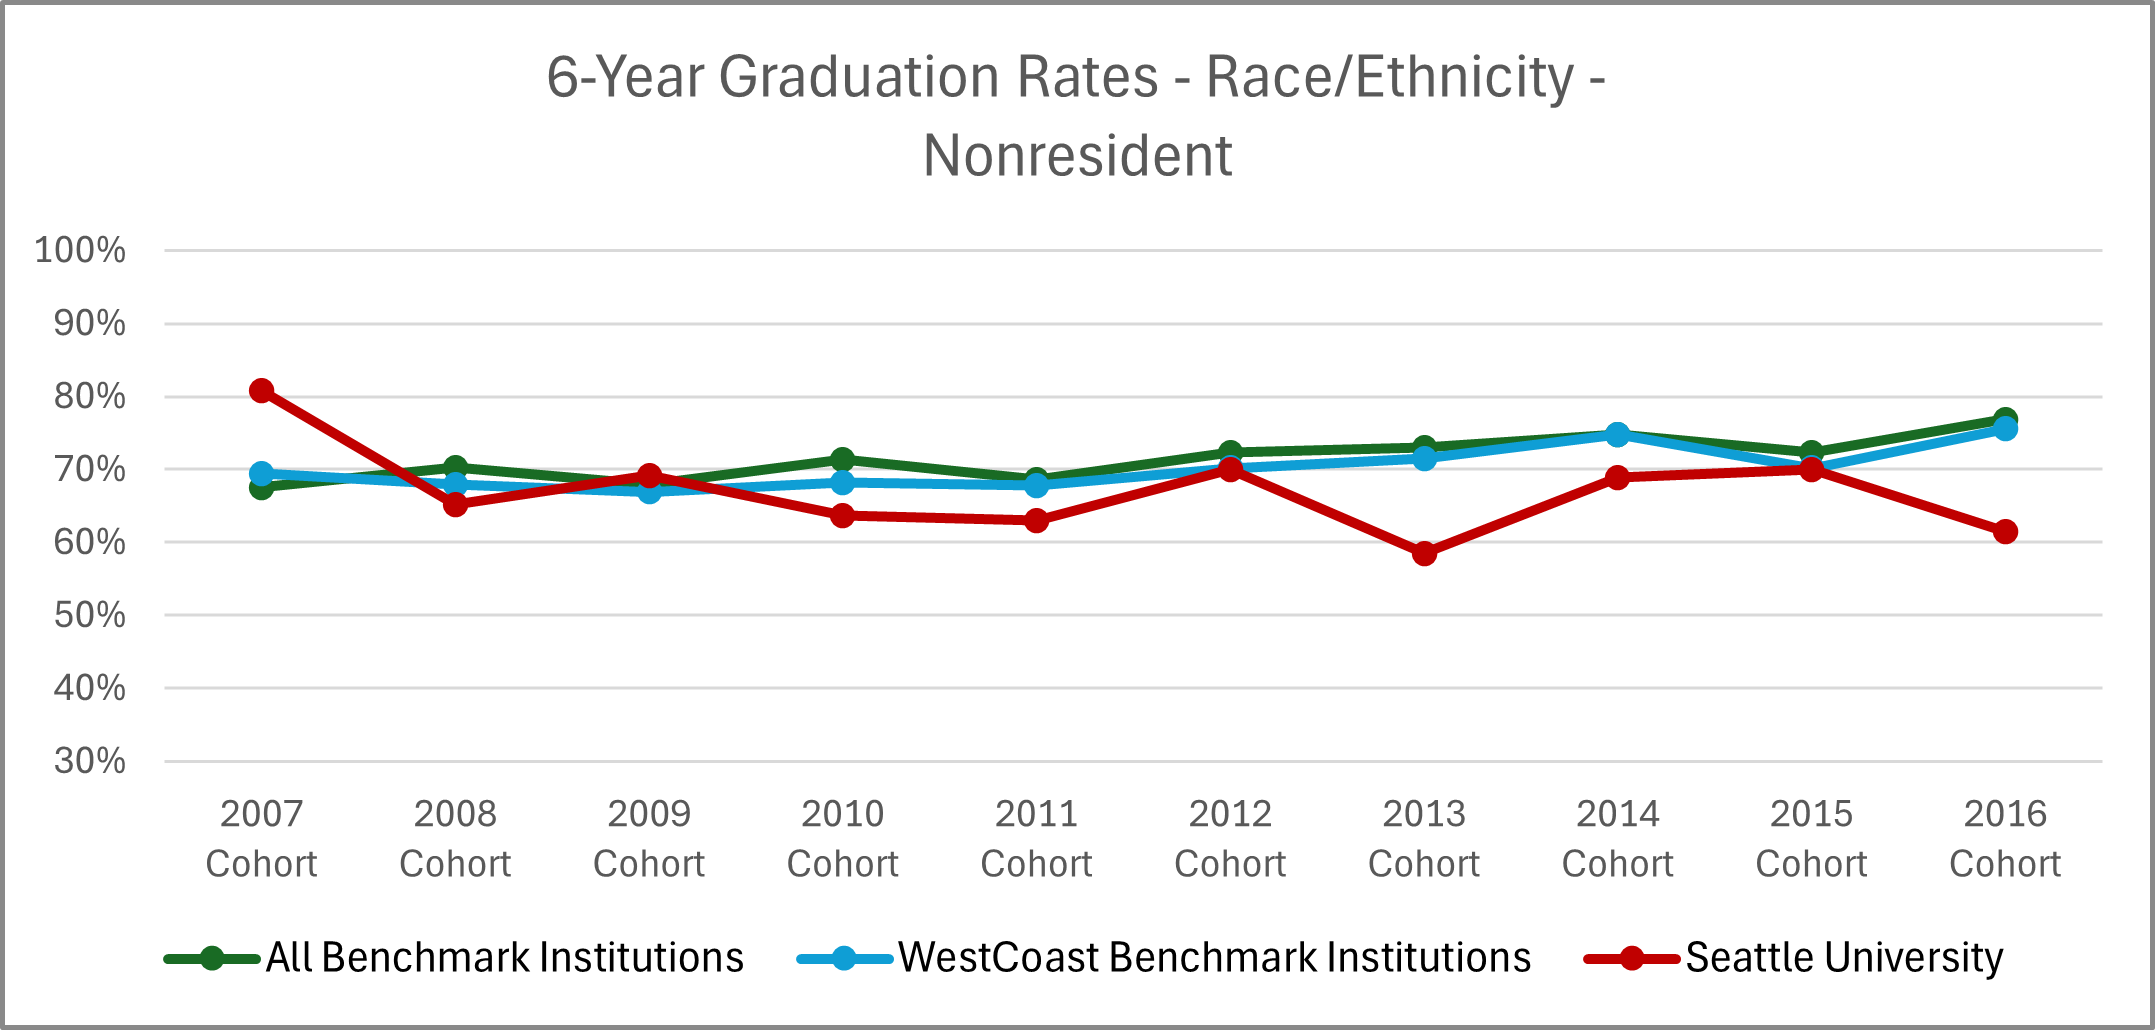
| Cohort Year | All Benchmark Institutions | WestCoast Benchmark Institutions | Seattle University |
|---|---|---|---|
| 2007 | 68% | 69% | 81% |
| 2008 | 70% | 68% | 65% |
| 2009 | 68% | 67% | 69% |
| 2010 | 71% | 68% | 64% |
| 2011 | 69% | 68% | 63% |
| 2012 | 72% | 70% | 70% |
| 2013 | 73% | 72% | 59% |
| 2014 | 75% | 75% | 69% |
| 2015 | 72% | 70% | 70% |
| 2016 | 77% | 76% | 62% |
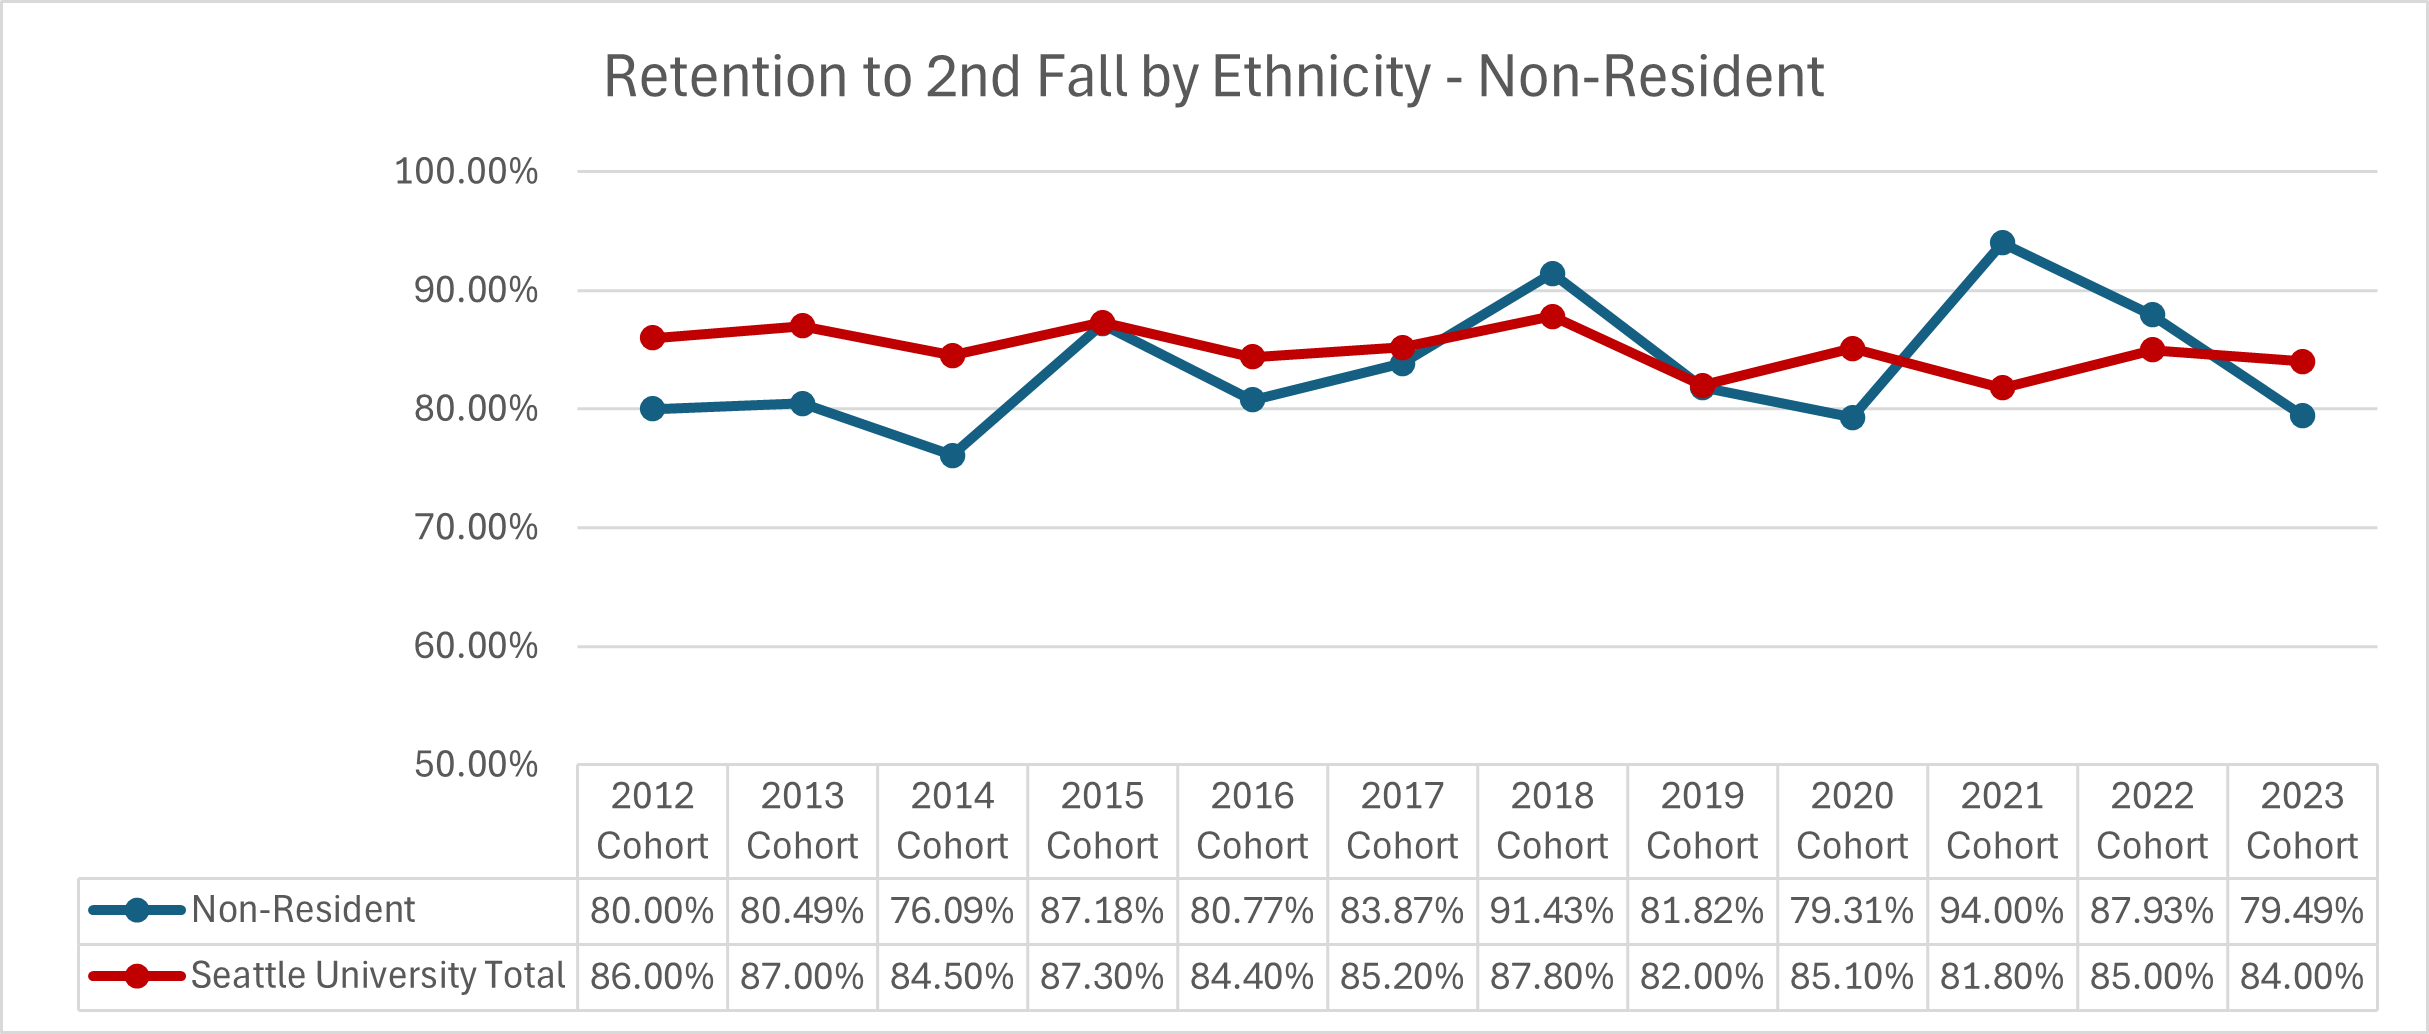
| Cohort Year | Non-Resident | Seattle University Total |
|---|---|---|
| 2012 | 80.00% | 86.00% |
| 2013 | 80.49% | 87.00% |
| 2014 | 76.09% | 84.50% |
| 2015 | 87.18% | 87.30% |
| 2016 | 80.77% | 84.40% |
| 2017 | 83.87% | 85.20% |
| 2018 | 91.43% | 87.80% |
| 2019 | 81.82% | 82.00% |
| 2020 | 79.31% | 85.10% |
| 2021 | 94.00% | 81.80% |
| 2022 | 87.93% | 85.00% |
| 2023 | 79.49% | 84.00% |
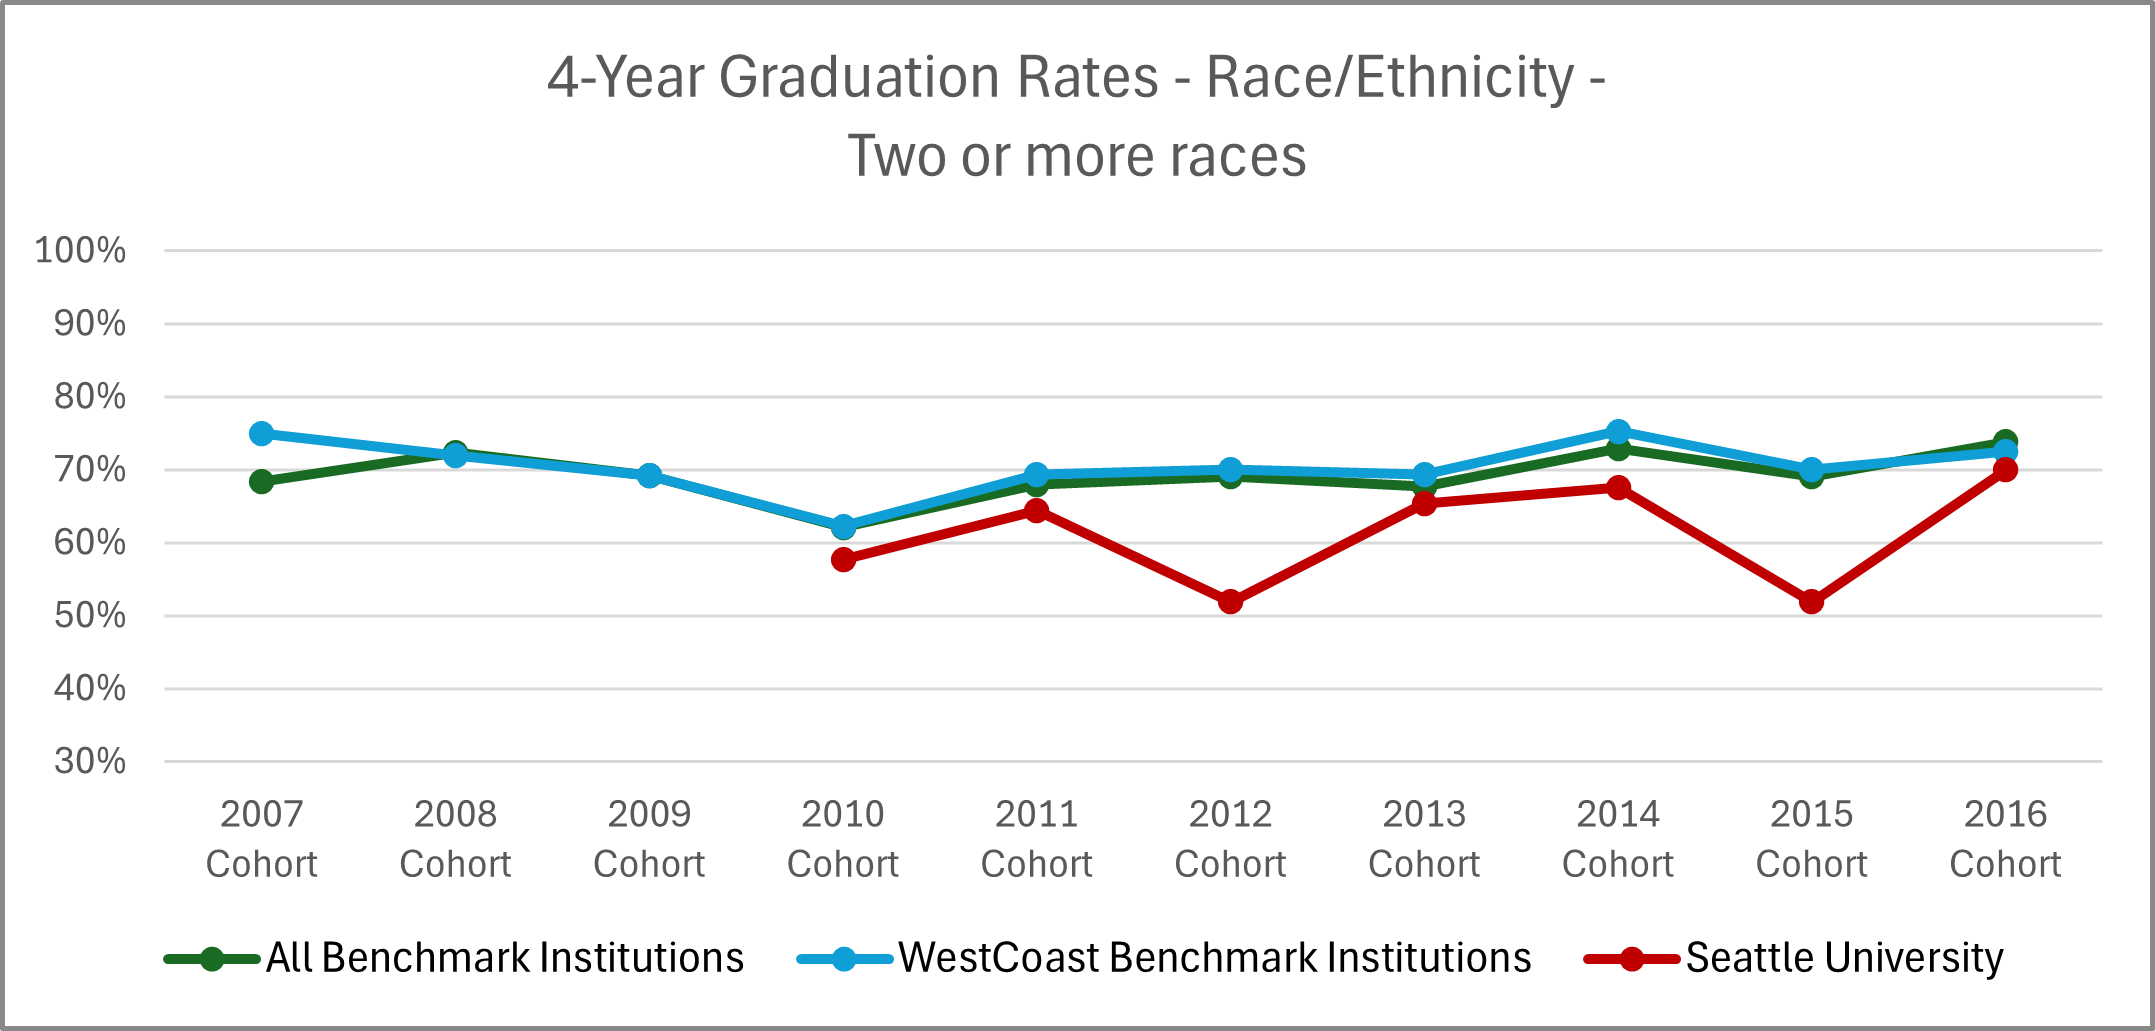
| Cohort Year | All Benchmark Institutions | WestCoast Benchmark Institutions | Seattle University |
|---|---|---|---|
| 2007 | 68% | 75% | - |
| 2008 | 72% | 72% | - |
| 2009 | 69% | 69% | - |
| 2010 | 62% | 62% | 58% |
| 2011 | 68% | 69% | 64% |
| 2012 | 69% | 70% | 52% |
| 2013 | 68% | 69% | 65% |
| 2014 | 73% | 75% | 68% |
| 2015 | 69% | 70% | 52% |
| 2016 | 74% | 73% | 70% |
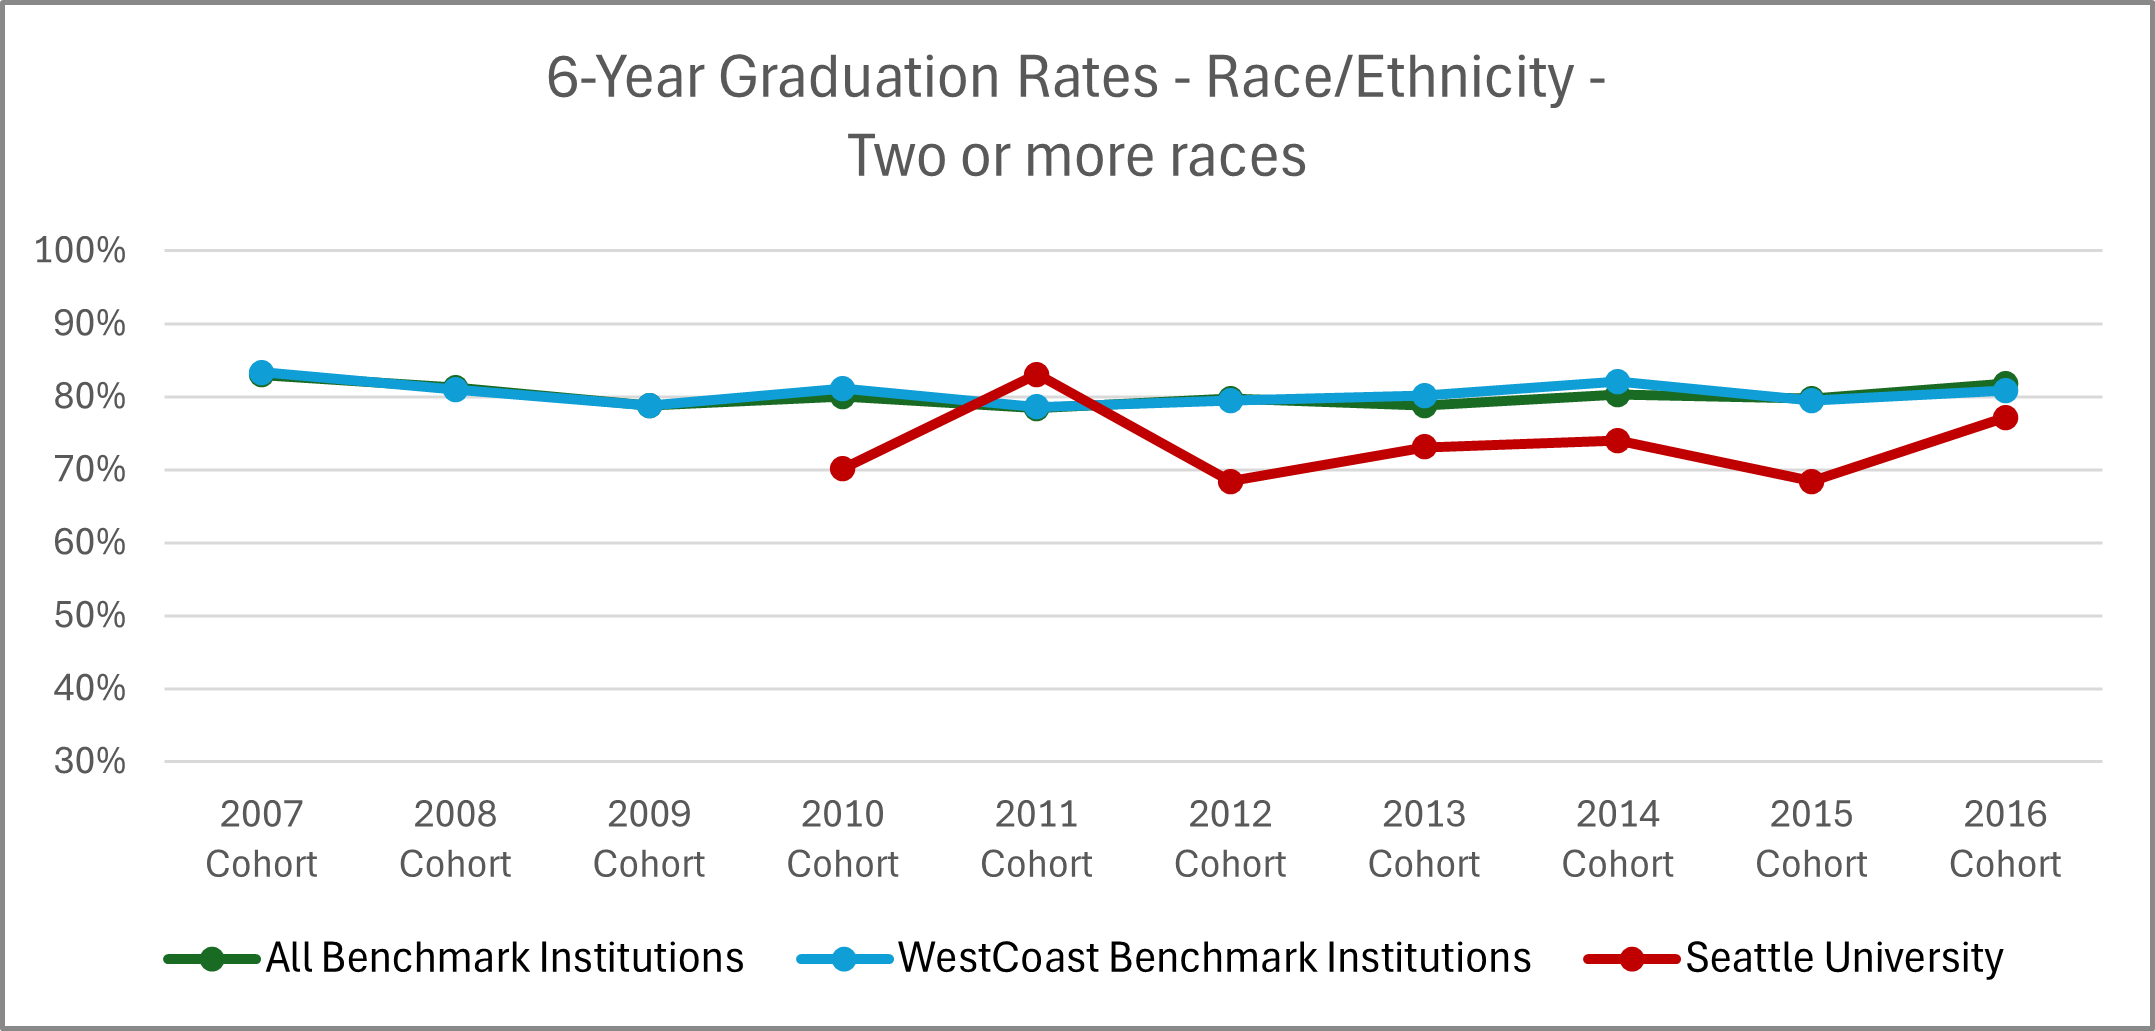
| Cohort Year | All Benchmark Institutions | WestCoast Benchmark Institutions | Seattle University |
|---|---|---|---|
| 2007 | 83% | 83% | - |
| 2008 | 81% | 81% | - |
| 2009 | 79% | 79% | - |
| 2010 | 80% | 81% | 70% |
| 2011 | 78% | 79% | 83% |
| 2012 | 80% | 79% | 68% |
| 2013 | 79% | 80% | 73% |
| 2014 | 80% | 82% | 74% |
| 2015 | 80% | 79% | 68% |
| 2016 | 82% | 81% | 77% |
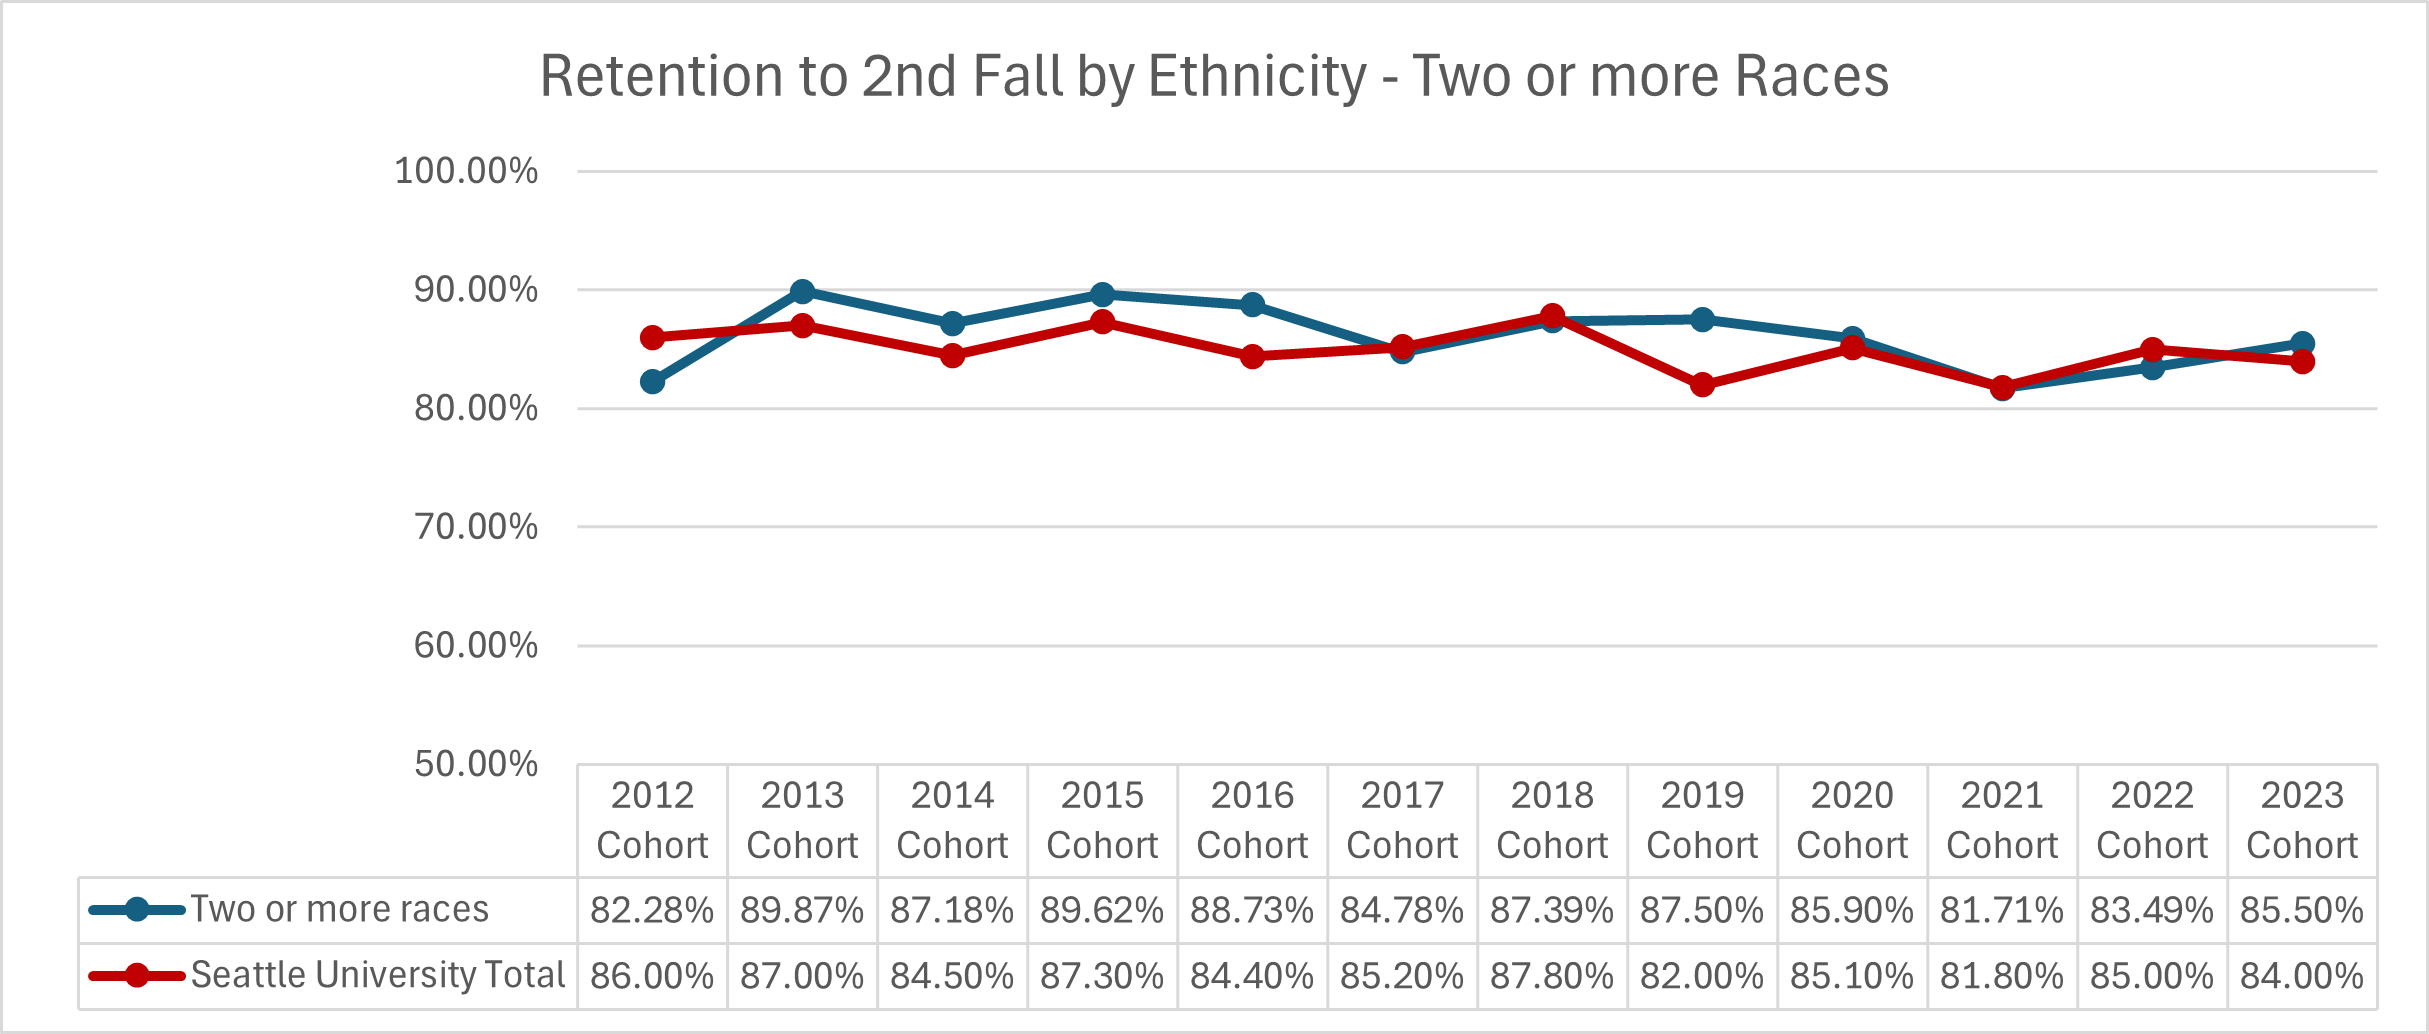
| Cohort Year | Two or More Races | Seattle University Total |
|---|---|---|
| 2012 | 82.28% | 86.00% |
| 2013 | 89.87% | 87.00% |
| 2014 | 87.18% | 84.50% |
| 2015 | 89.62% | 87.30% |
| 2016 | 88.73% | 84.40% |
| 2017 | 84.78% | 85.20% |
| 2018 | 87.39% | 87.80% |
| 2019 | 87.50% | 82.00% |
| 2020 | 85.90% | 85.10% |
| 2021 | 81.71% | 81.80% |
| 2022 | 83.49% | 85.00% |
| 2023 | 85.50% | 84.00% |
| Cohort Year | All Benchmark Institutions | WestCoast Benchmark Institutions | Seattle University |
|---|---|---|---|
| 2007 | 65% | 70% | 56% |
| 2008 | 69% | 68% | 79% |
| 2009 | 68% | 67% | 68% |
| 2010 | 69% | 67% | 66% |
| 2011 | 70% | 70% | 65% |
| 2012 | 70% | 69% | 57% |
| 2013 | 73% | 73% | 67% |
| 2014 | 67% | 67% | 58% |
| 2015 | 70% | 69% | 57% |
| 2016 | 64% | 61% | 64% |
| Cohort Year | All Benchmark Institutions | WestCoast Benchmark Institutions | Seattle University |
|---|---|---|---|
| 2007 | 74% | 78% | 71% |
| 2008 | 74% | 72% | 86% |
| 2009 | 79% | 79% | 79% |
| 2010 | 82% | 84% | 76% |
| 2011 | 78% | 80% | 81% |
| 2012 | 79% | 80% | 67% |
| 2013 | 82% | 83% | 79% |
| 2014 | 81% | 84% | 68% |
| 2015 | 79% | 80% | 67% |
| 2016 | 79% | 79% | 73% |
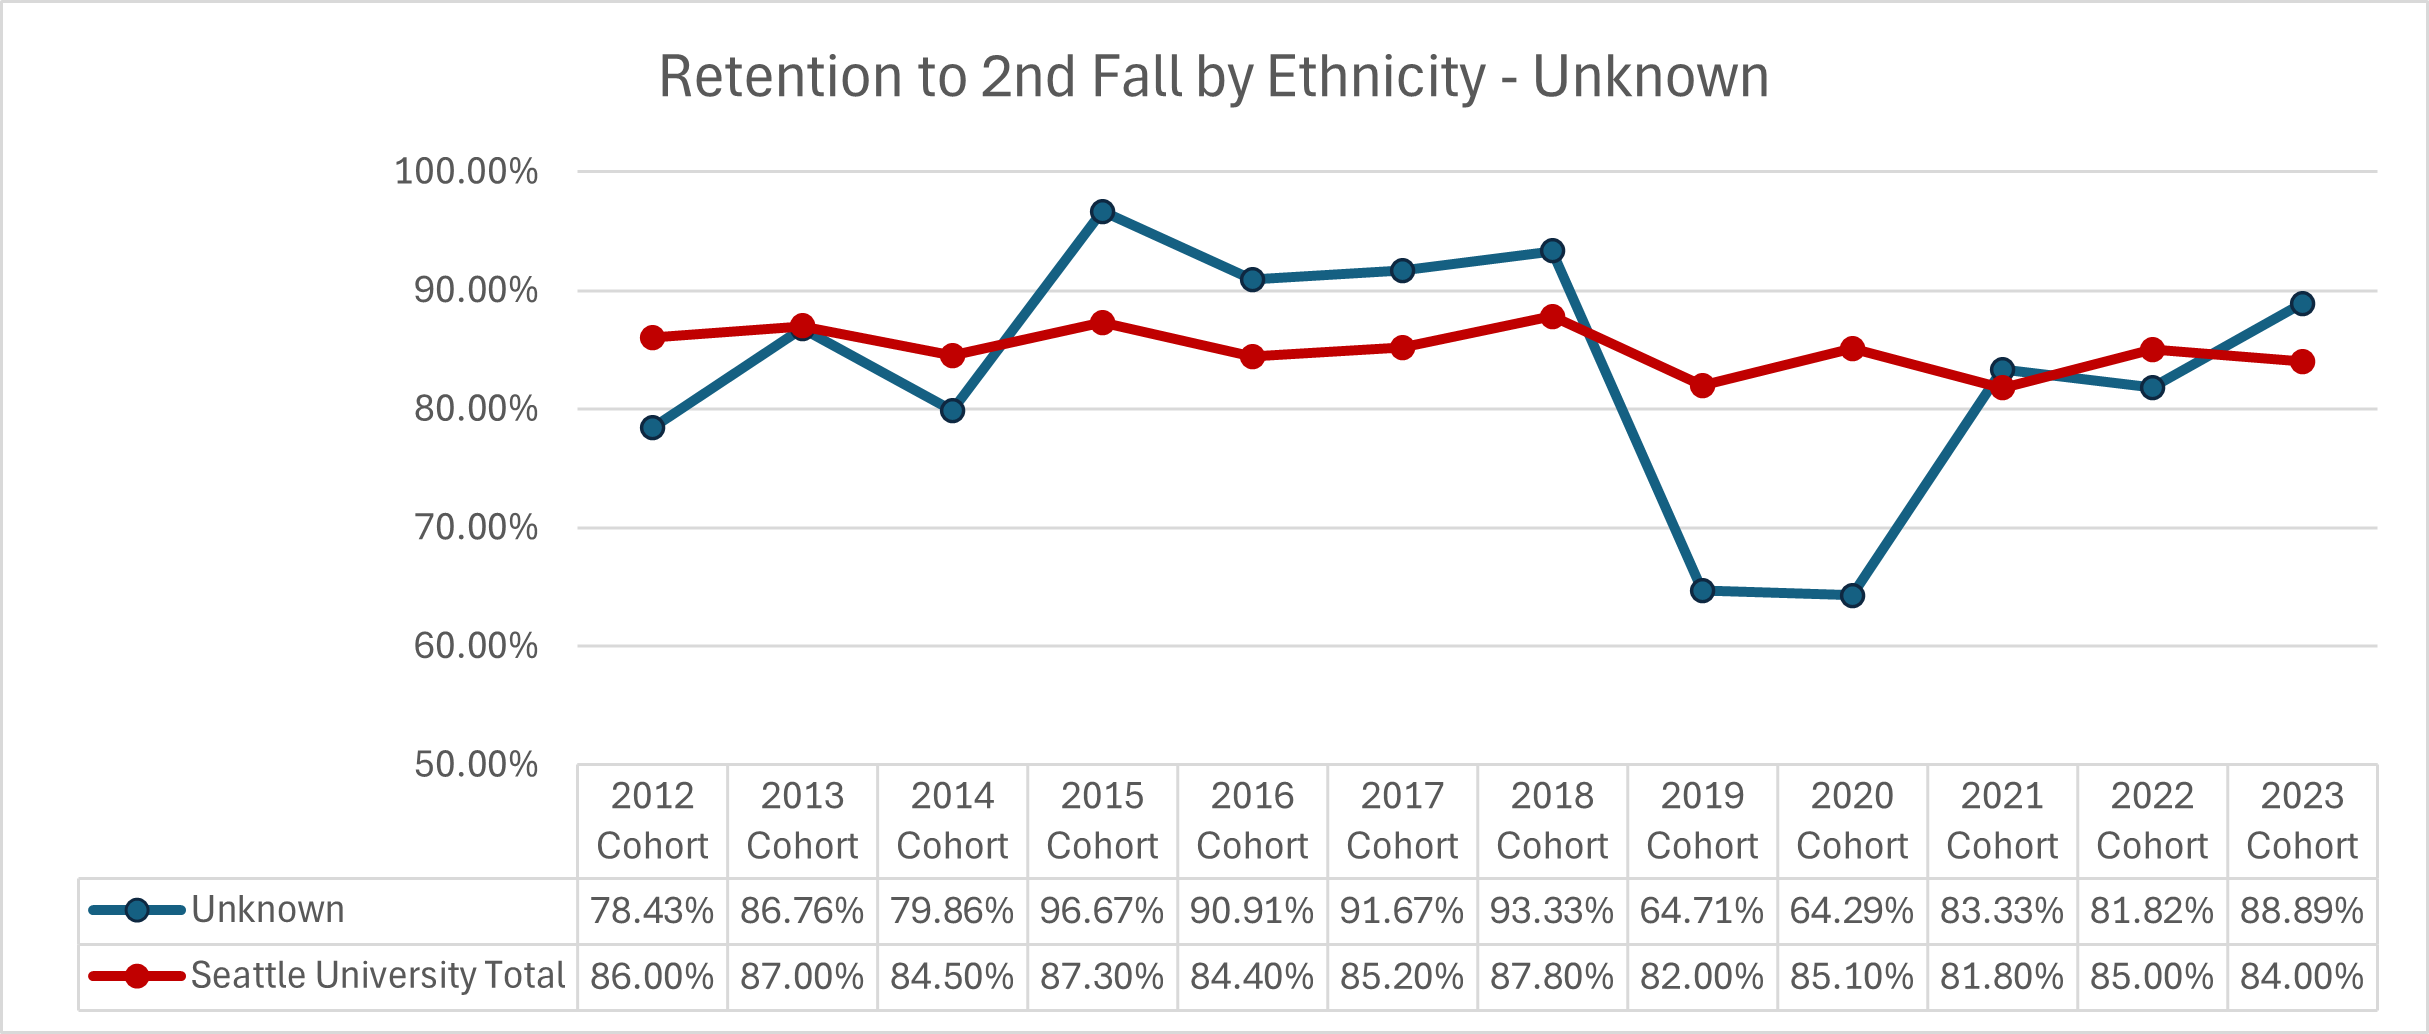
| Cohort Year | Unknown | Seattle University Total |
|---|---|---|
| 2012 | 78.43% | 86.00% |
| 2013 | 86.76% | 87.00% |
| 2014 | 79.86% | 84.50% |
| 2015 | 96.67% | 87.30% |
| 2016 | 90.91% | 84.40% |
| 2017 | 91.67% | 85.20% |
| 2018 | 93.33% | 87.80% |
| 2019 | 64.71% | 82.00% |
| 2020 | 64.29% | 85.10% |
| 2021 | 83.33% | 81.80% |
| 2022 | 81.82% | 85.00% |
| 2023 | 88.89% | 84.00% |
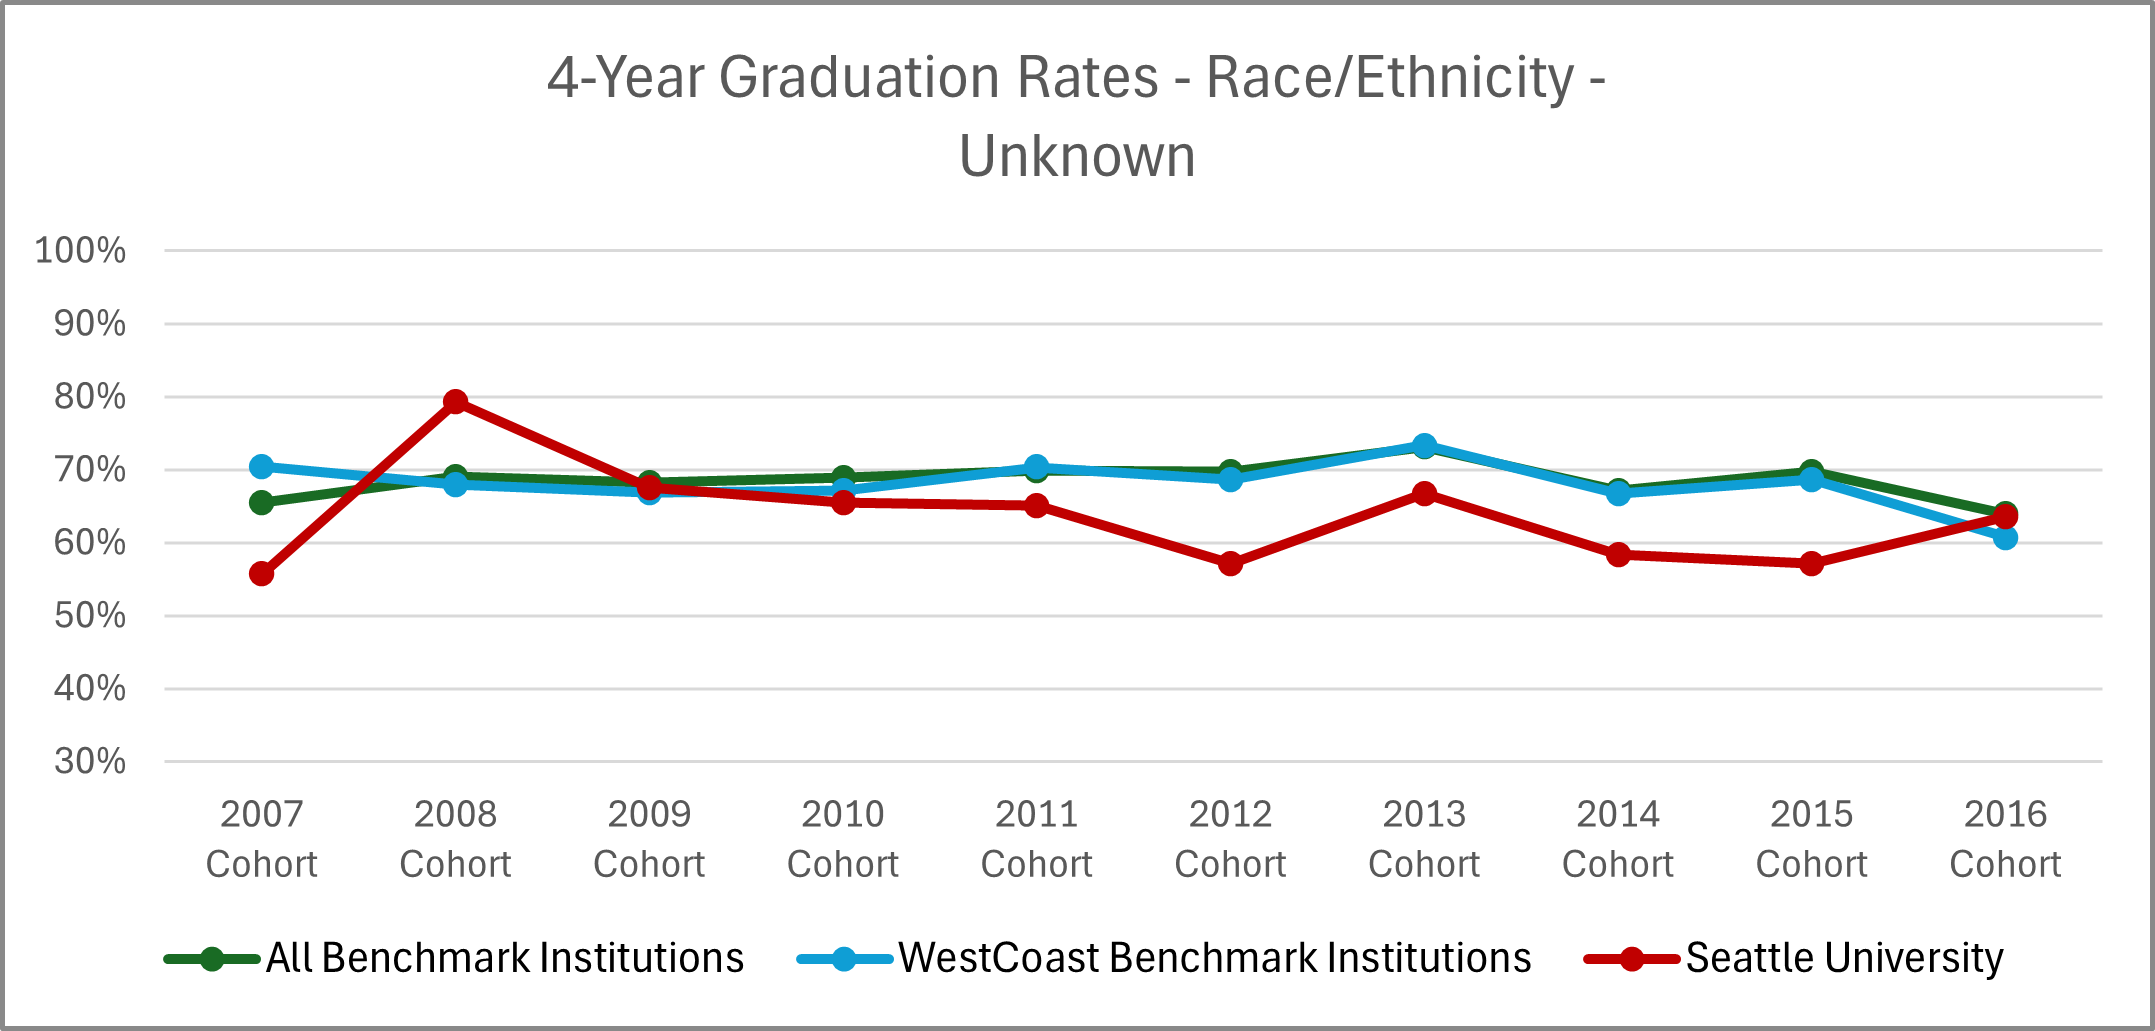
| Cohort Year | All Benchmark Institutions | WestCoast Benchmark Institutions | Seattle University |
|---|---|---|---|
| 2007 | 69% | 70% | 62% |
| 2008 | 71% | 73% | 64% |
| 2009 | 70% | 69% | 65% |
| 2010 | 64% | 58% | 65% |
| 2011 | 72% | 73% | 65% |
| 2012 | 74% | 74% | 63% |
| 2013 | 73% | 73% | 64% |
| 2014 | 74% | 74% | 63% |
| 2015 | 74% | 74% | 63% |
| 2016 | 74% | 74% | 67% |
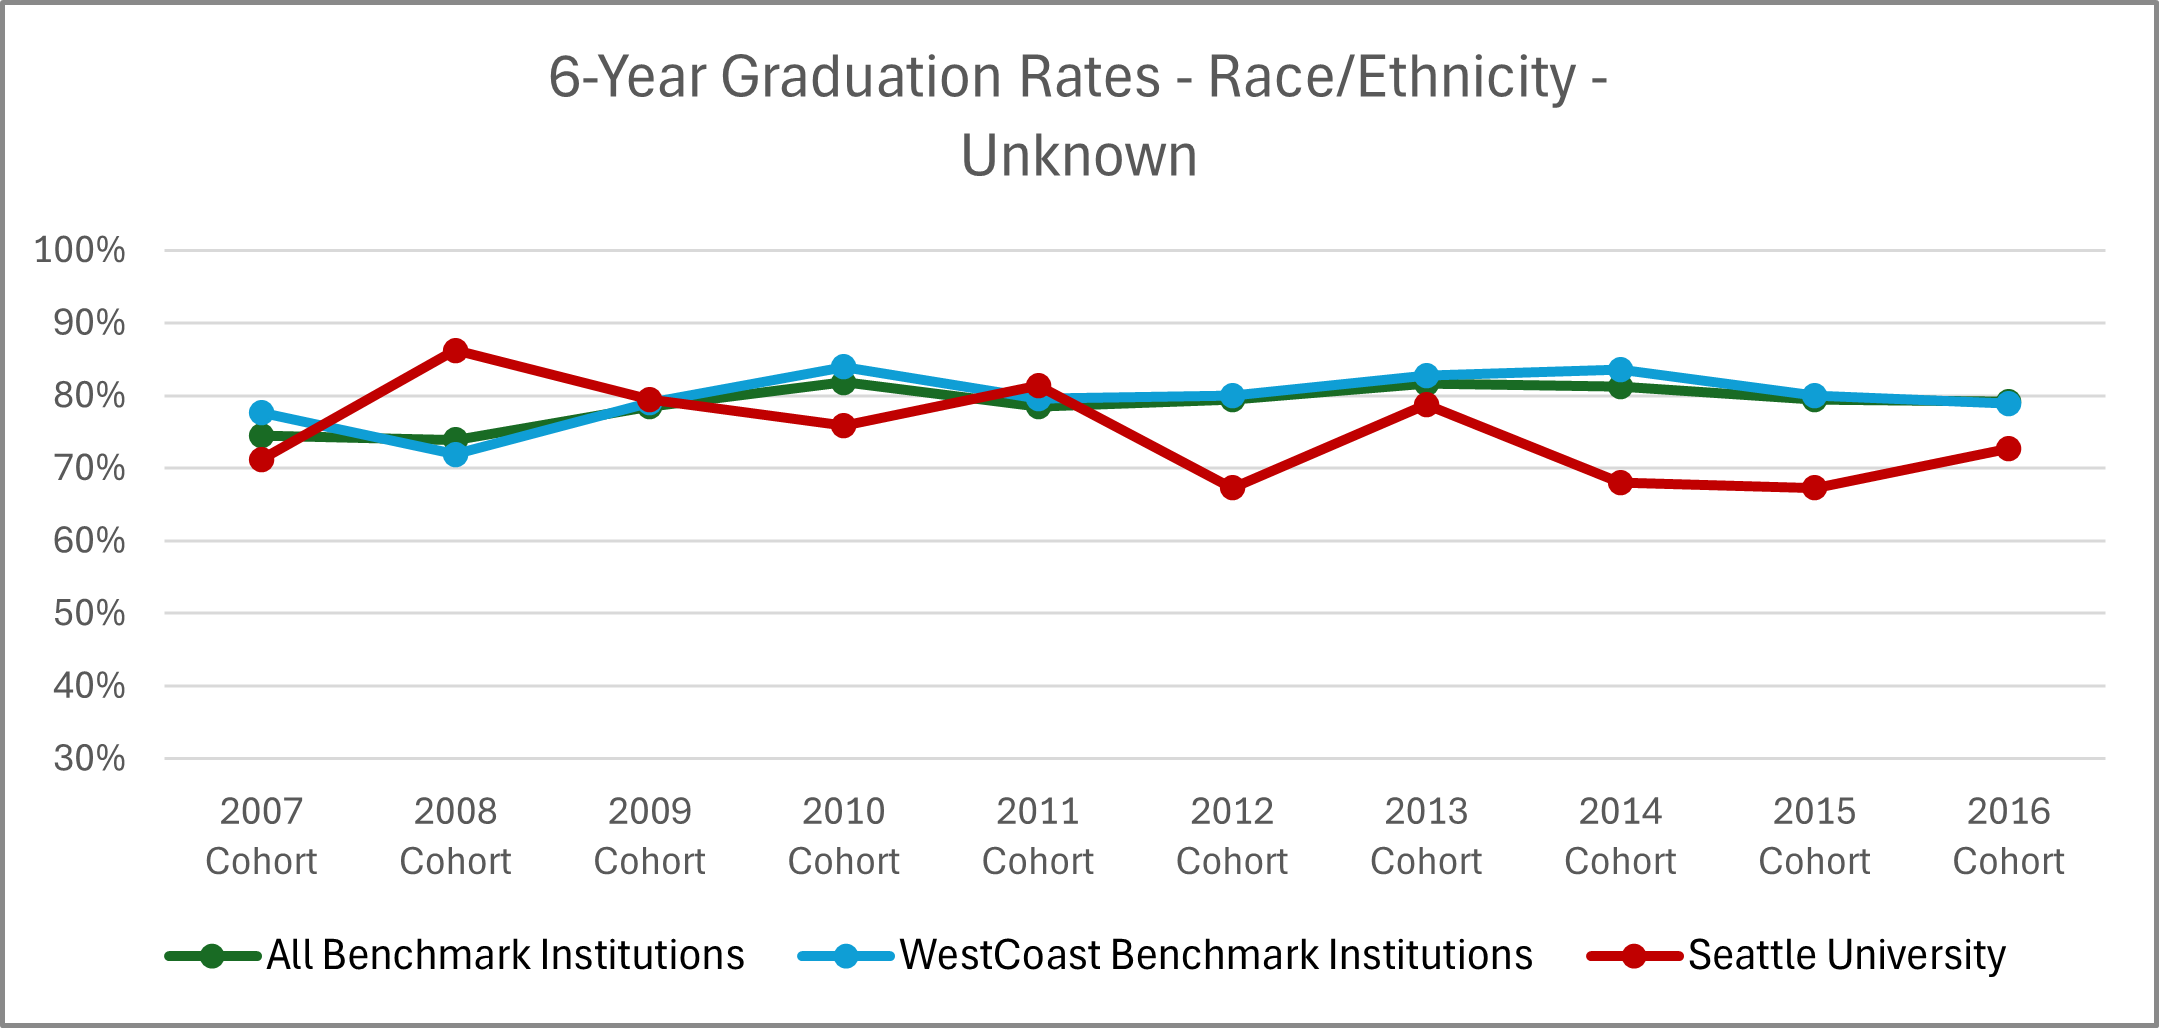
| Cohort Year | All Benchmark Institutions | WestCoast Benchmark Institutions | Seattle University |
|---|---|---|---|
| 2007 | 79% | 81% | 76% |
| 2008 | 76% | 73% | 80% |
| 2009 | 81% | 80% | 77% |
| 2010 | 81% | 81% | 74% |
| 2011 | 82% | 82% | 75% |
| 2012 | 83% | 83% | 74% |
| 2013 | 82% | 82% | 75% |
| 2014 | 82% | 82% | 72% |
| 2015 | 83% | 83% | 74% |
| 2016 | 82% | 82% | 72% |
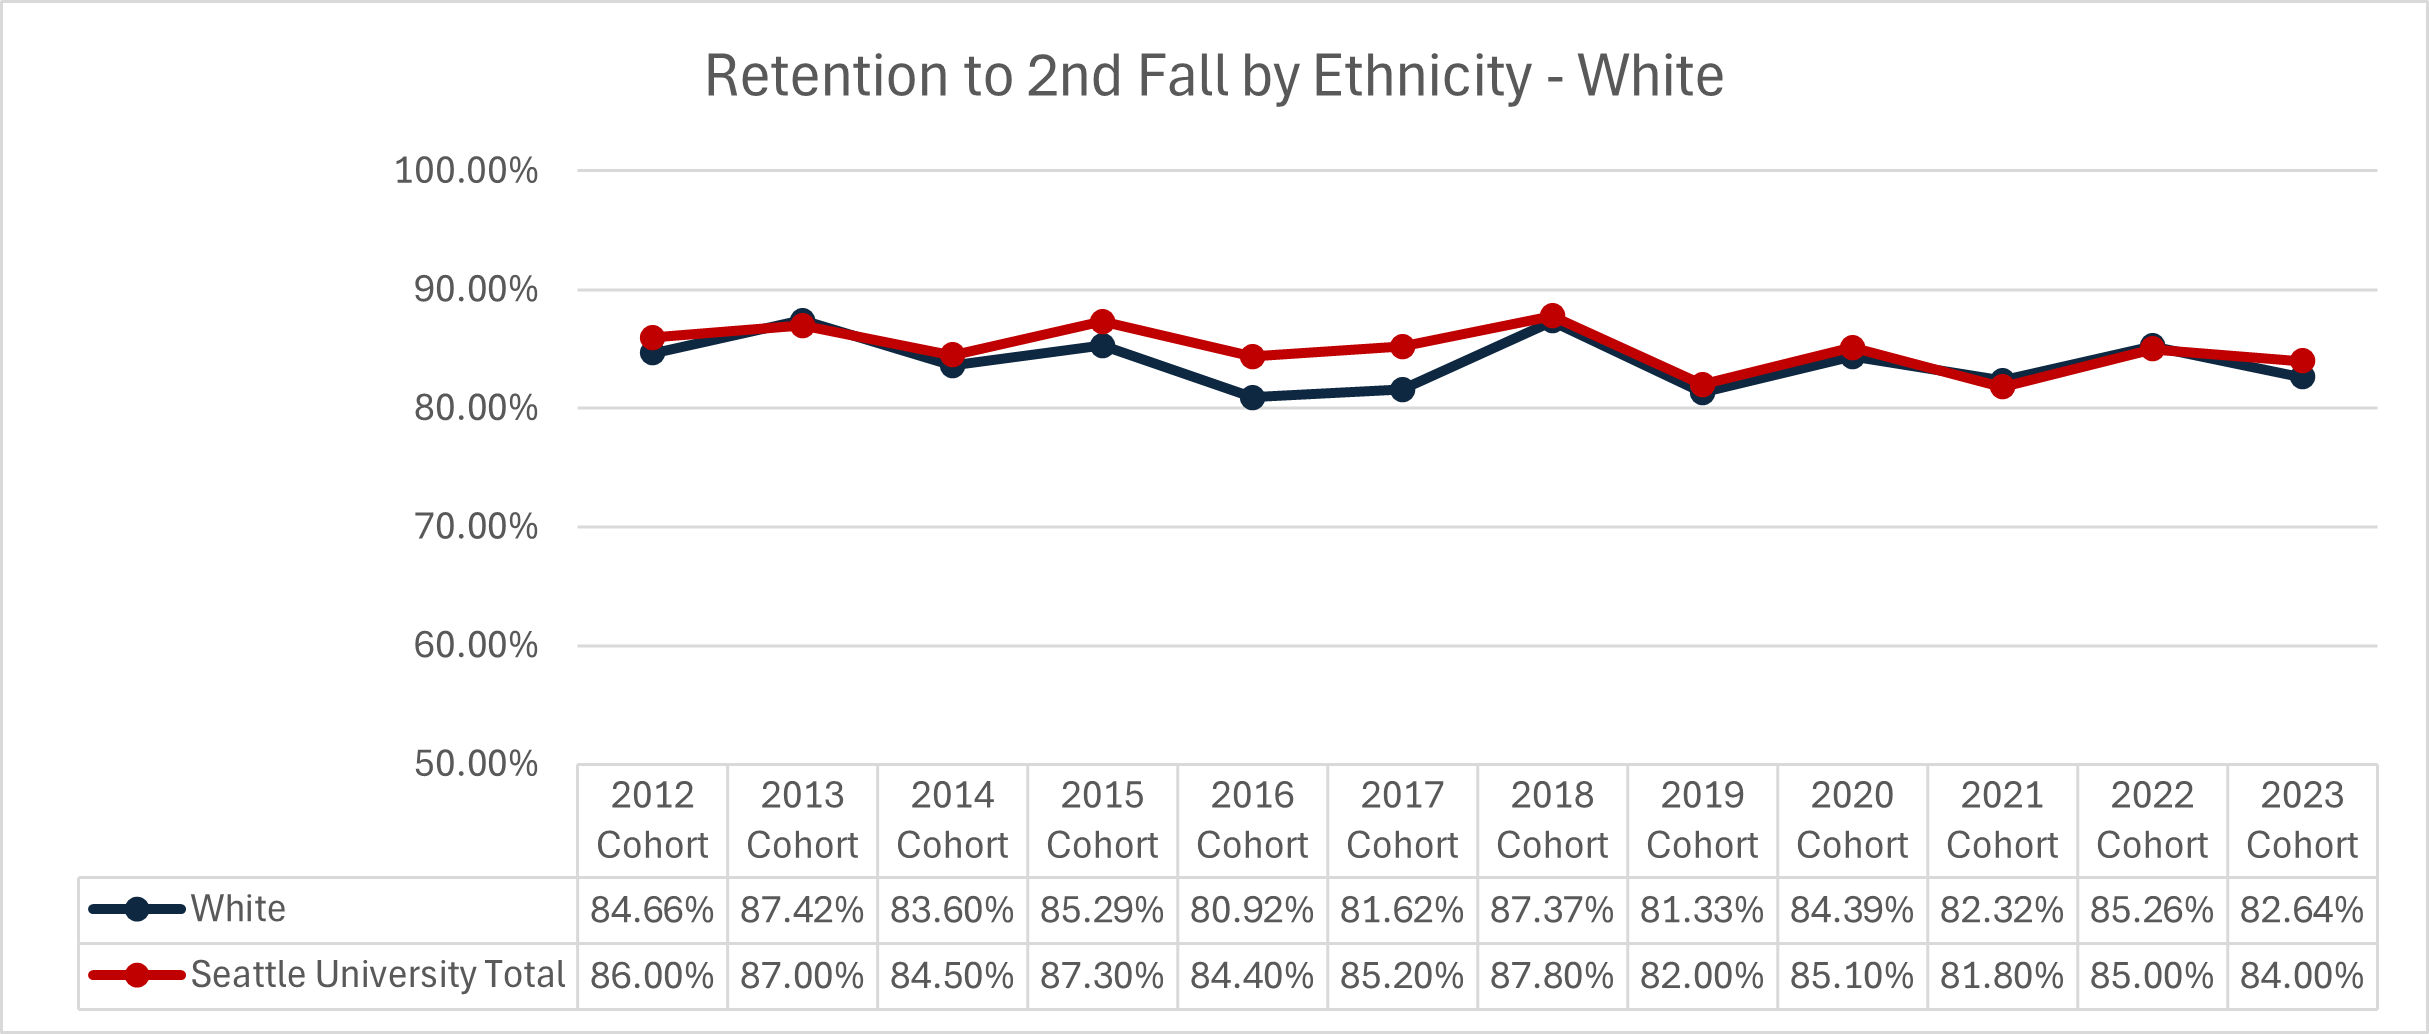
| Cohort Year | White | Seattle University Total |
|---|---|---|
| 2012 | 84.66% | 86.00% |
| 2013 | 87.42% | 87.00% |
| 2014 | 83.60% | 84.50% |
| 2015 | 85.29% | 87.30% |
| 2016 | 80.92% | 84.40% |
| 2017 | 81.62% | 85.20% |
| 2018 | 87.37% | 87.80% |
| 2019 | 81.33% | 82.00% |
| 2020 | 84.39% | 85.10% |
| 2021 | 82.32% | 81.80% |
| 2022 | 85.26% | 85.00% |
| 2023 | 82.64% | 84.00% |
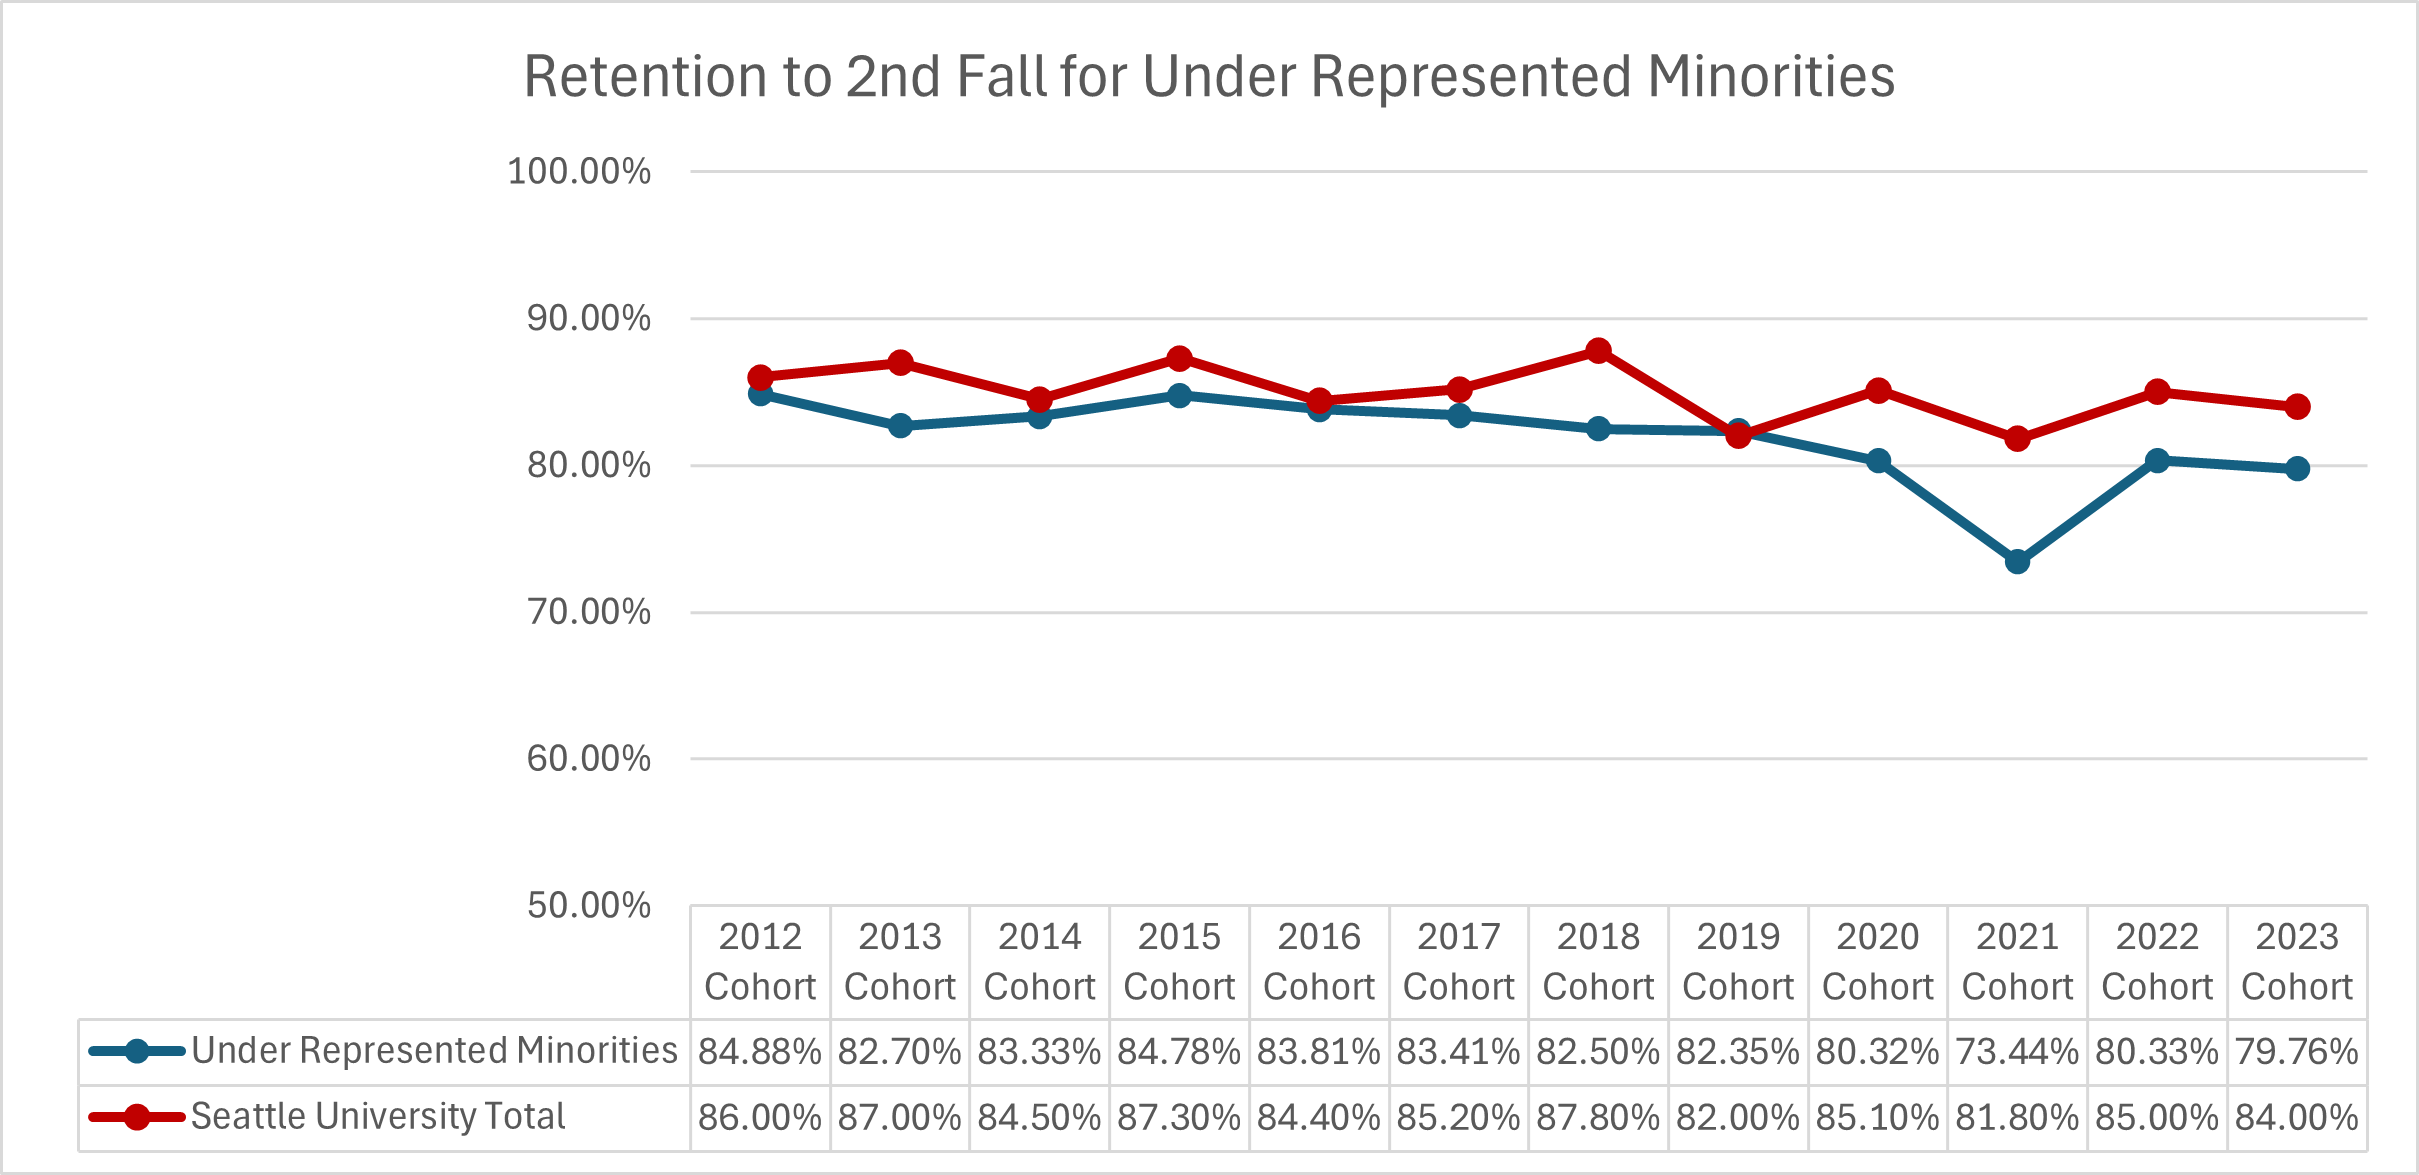
| Cohort Year | Under Represented Minorities | Seattle University Total |
|---|---|---|
| 2012 | 84.88% | 86.00% |
| 2013 | 82.70% | 87.00% |
| 2014 | 83.33% | 84.50% |
| 2015 | 84.78% | 87.30% |
| 2016 | 83.81% | 84.40% |
| 2017 | 83.41% | 85.20% |
| 2018 | 82.50% | 87.80% |
| 2019 | 82.35% | 82.00% |
| 2020 | 80.32% | 85.10% |
| 2021 | 73.44% | 81.80% |
| 2022 | 80.33% | 85.00% |
| 2023 | 79.76% | 84.00% |
Other Retention Comparisons
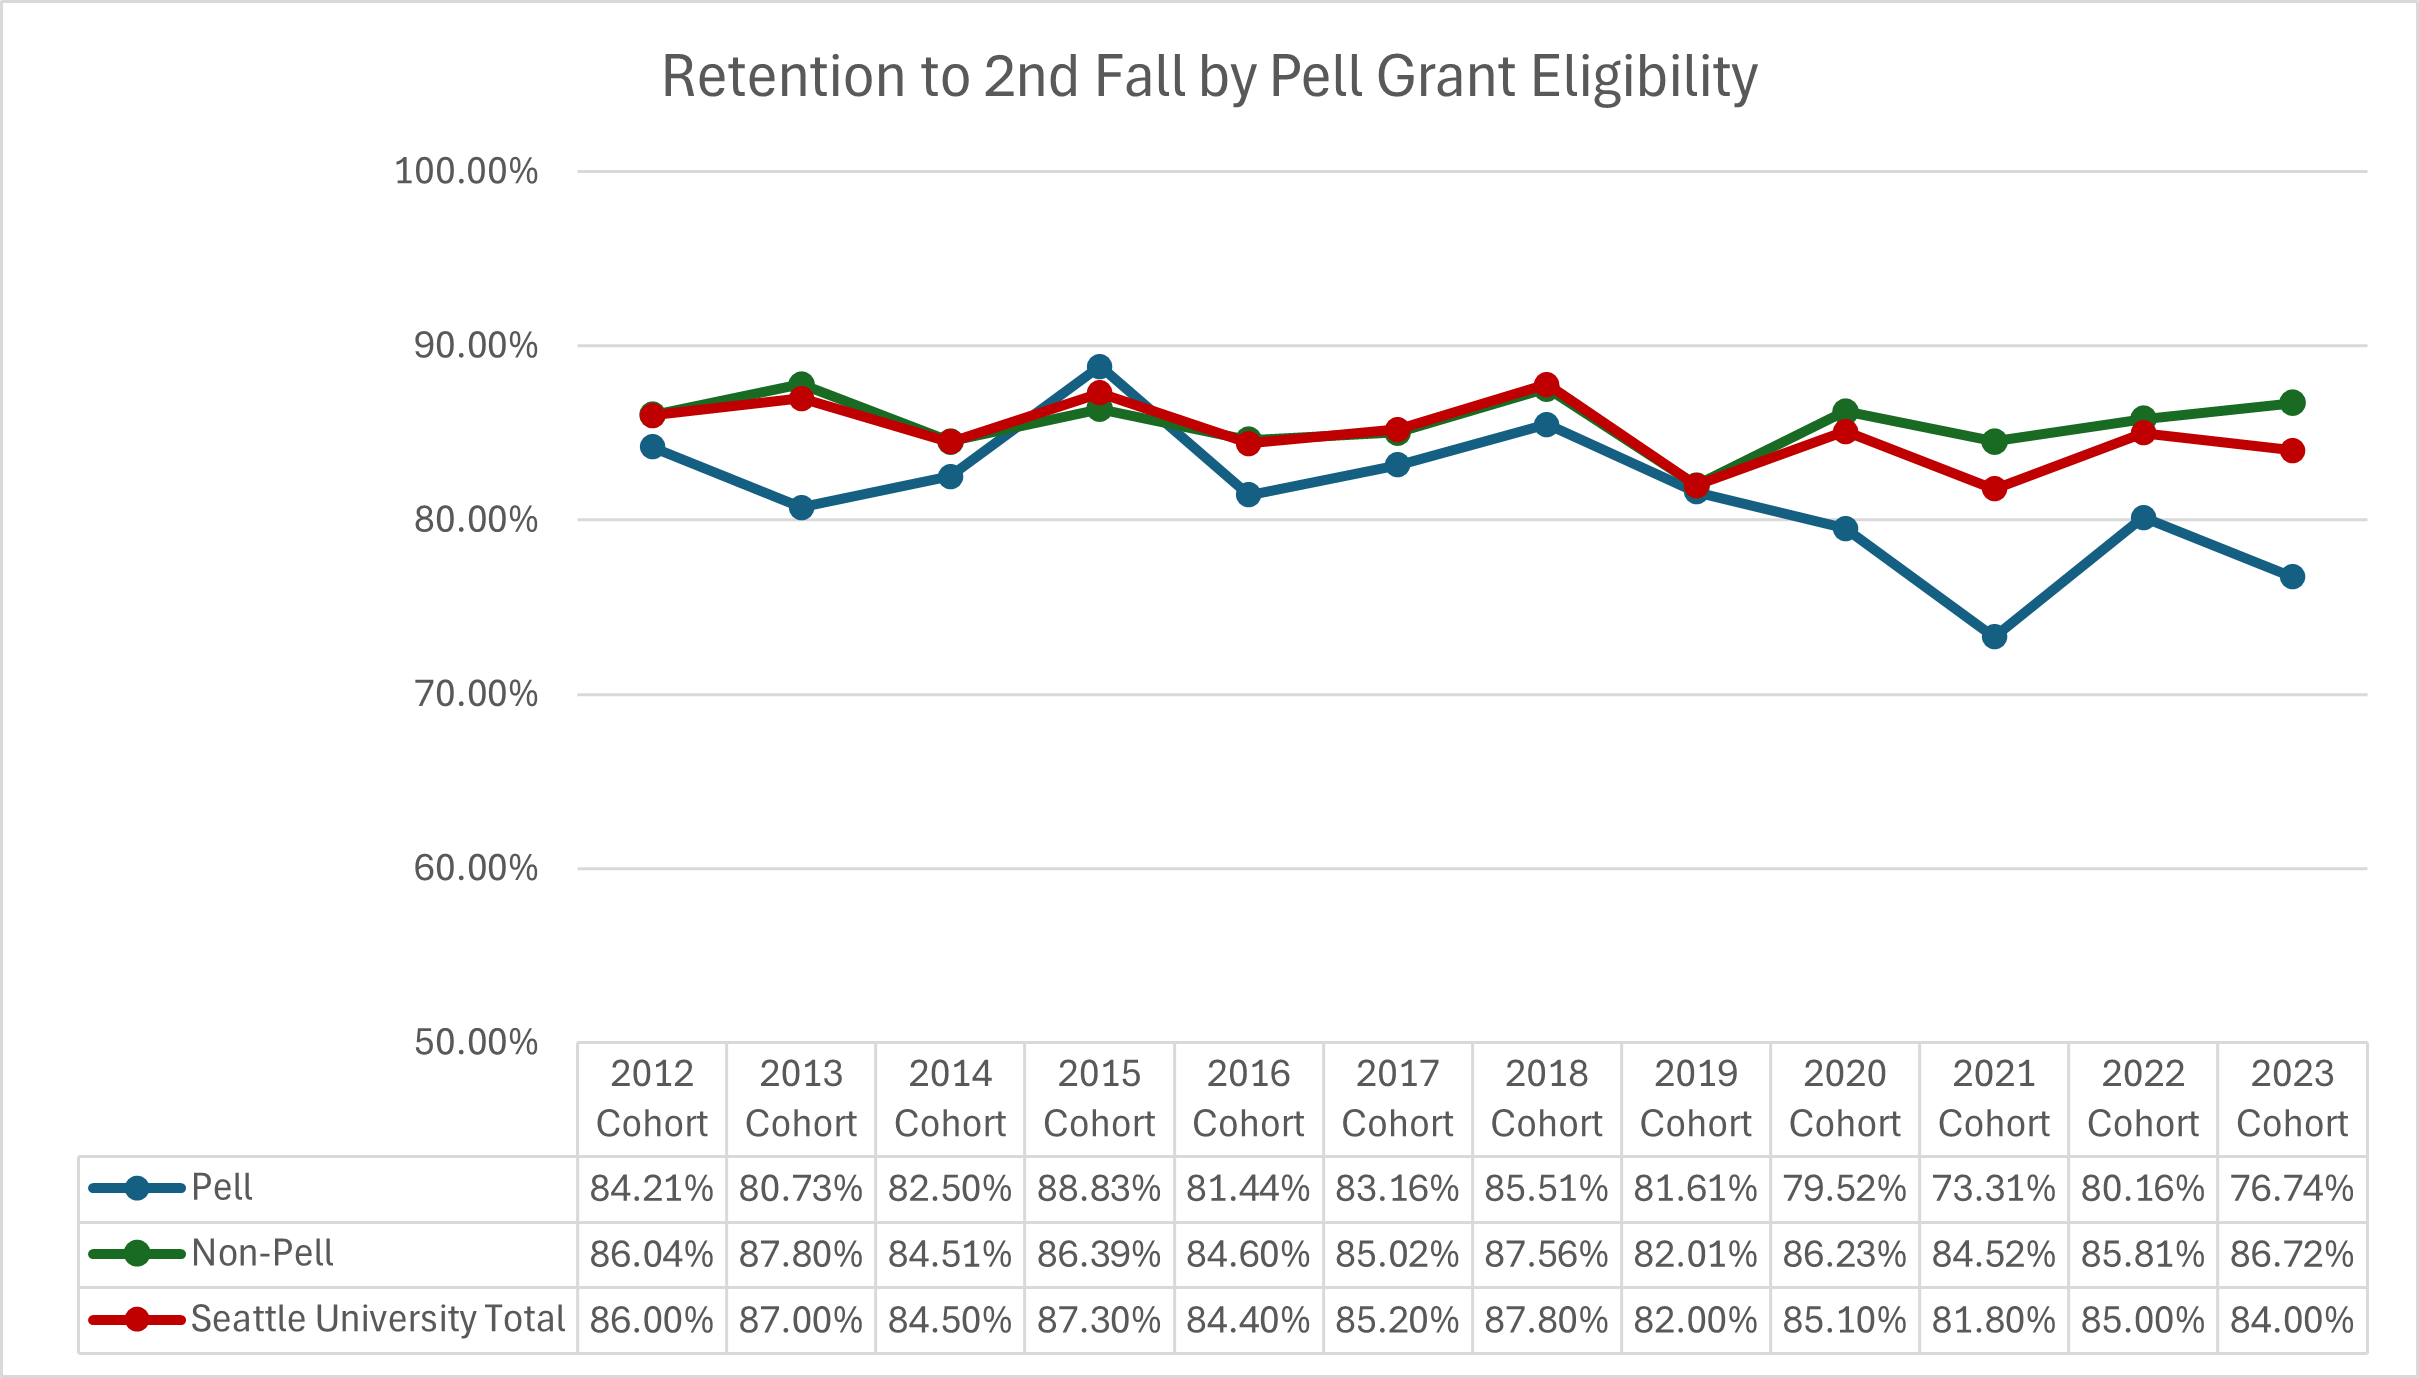
| Cohort Year | Pell | Non-Pell | Seattle University Total |
|---|---|---|---|
| 2012 | 84.21% | 86.04% | 86.00% |
| 2013 | 80.73% | 87.80% | 87.00% |
| 2014 | 82.50% | 84.51% | 84.50% |
| 2015 | 88.83% | 86.39% | 87.30% |
| 2016 | 81.44% | 84.60% | 84.40% |
| 2017 | 83.16% | 85.02% | 85.20% |
| 2018 | 85.51% | 87.56% | 87.80% |
| 2019 | 81.61% | 82.01% | 82.00% |
| 2020 | 79.52% | 86.23% | 85.10% |
| 2021 | 73.31% | 84.52% | 81.80% |
| 2022 | 80.16% | 85.81% | 85.00% |
| 2023 | 76.74% | 86.72% | 84.00% |
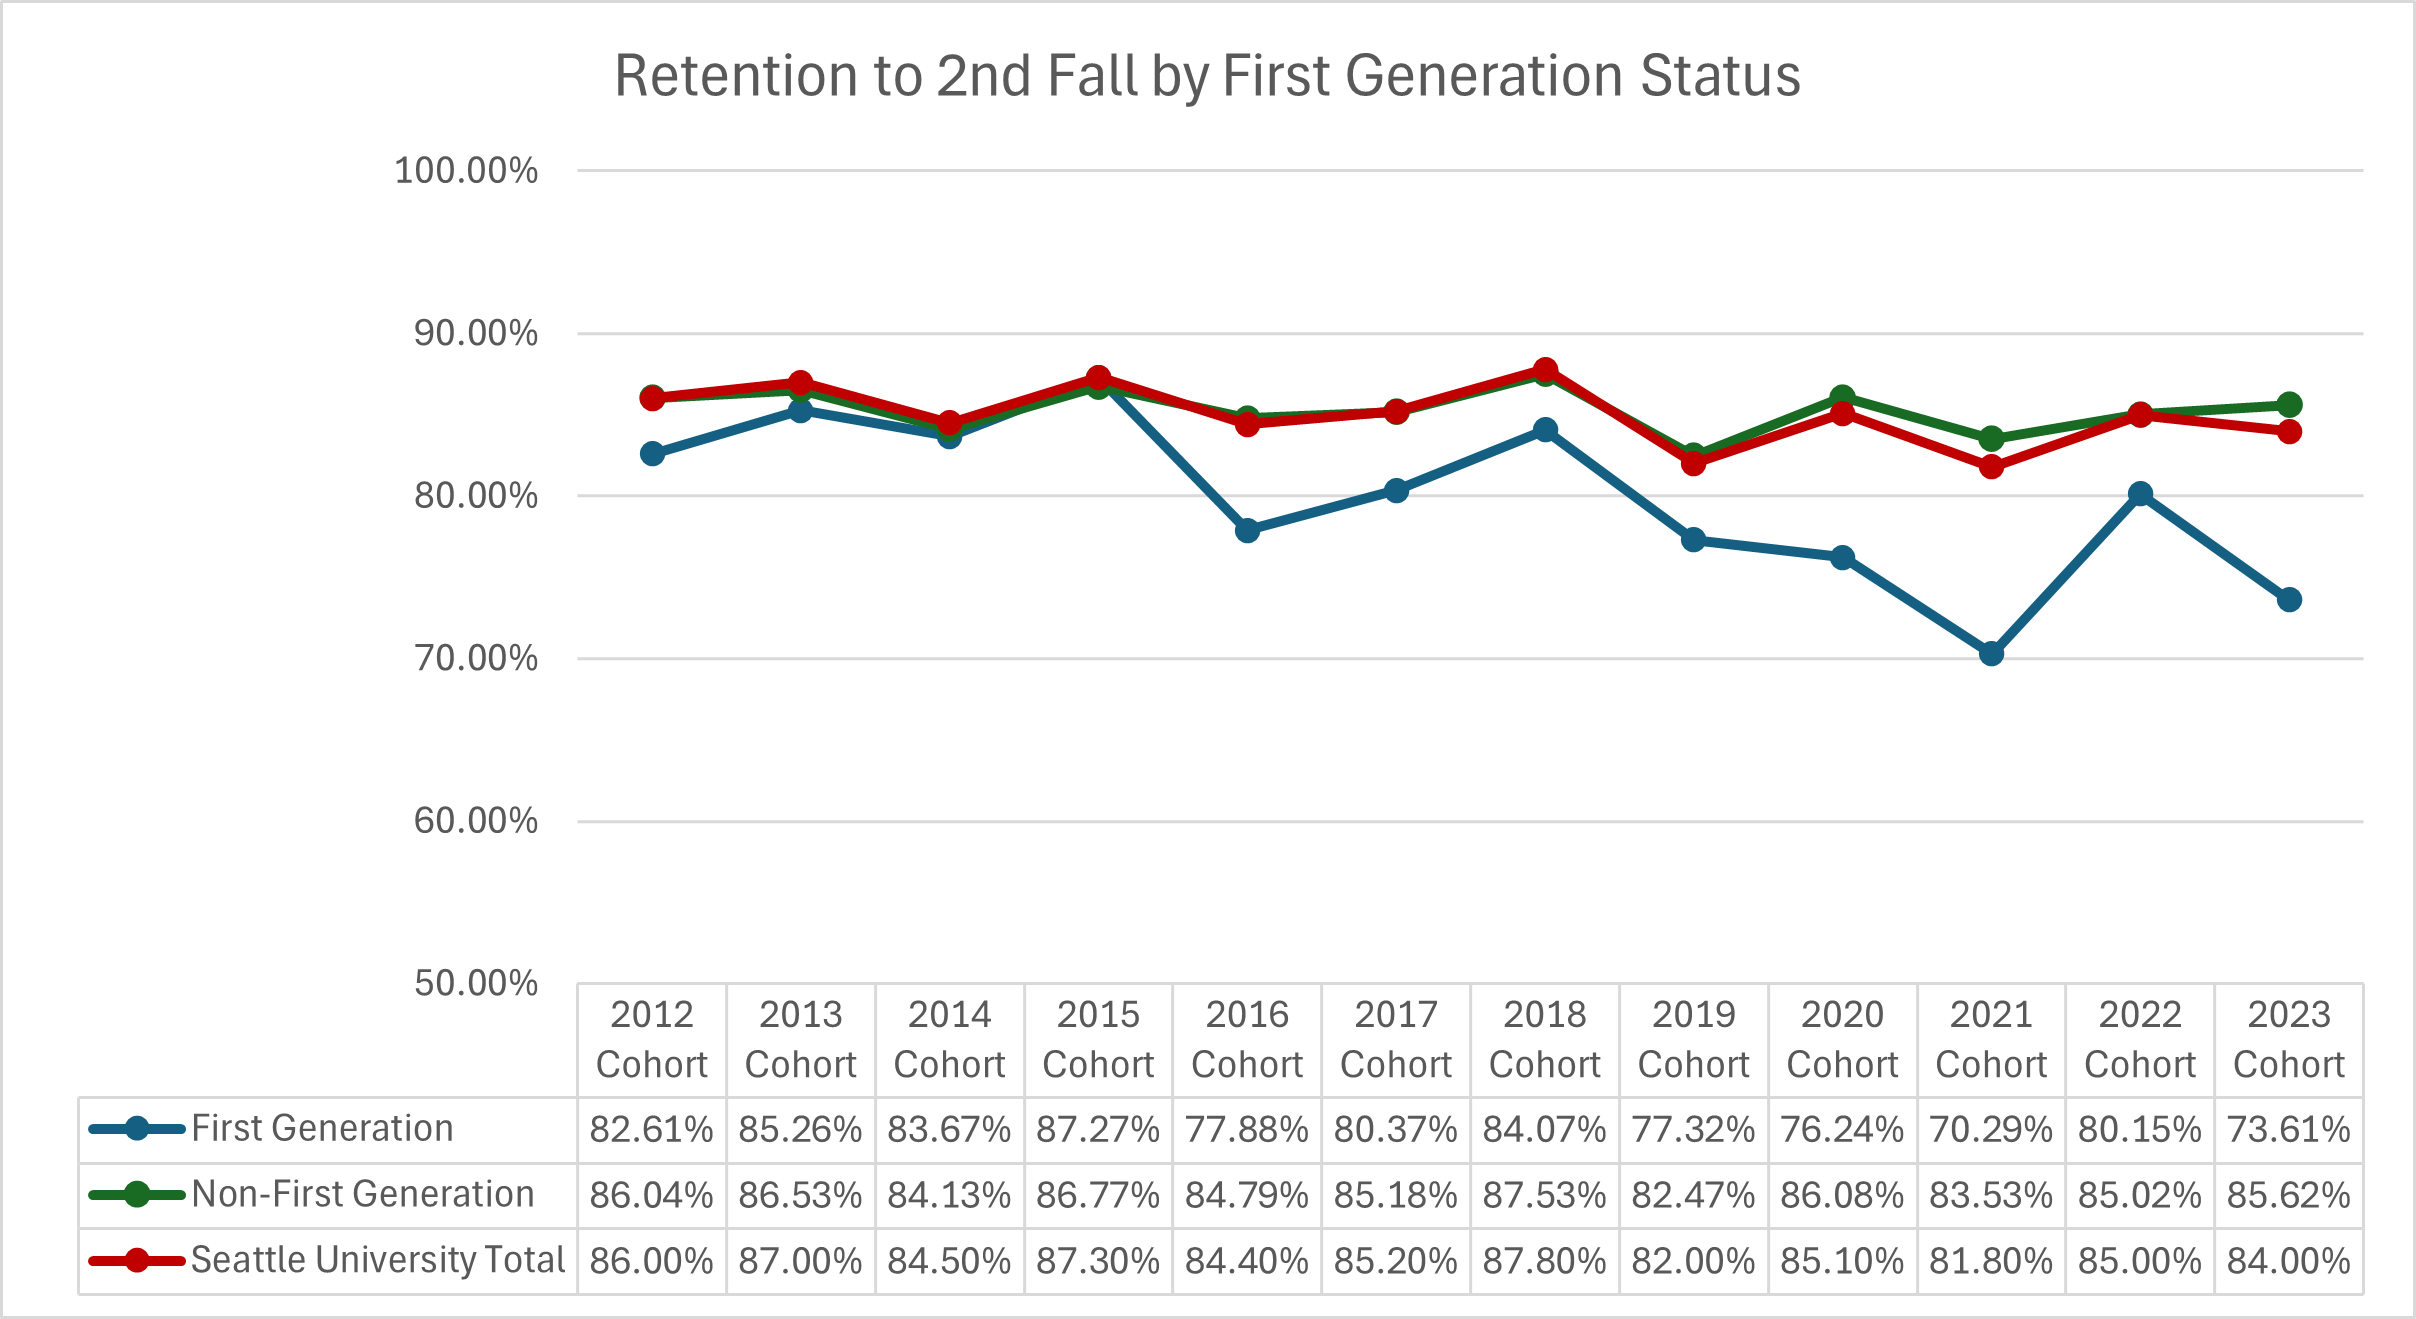
| Cohort Year | First Generation | Non-First Generation | Seattle University Total |
|---|---|---|---|
| 2012 | 82.61% | 86.04% | 86.00% |
| 2013 | 85.26% | 86.53% | 87.00% |
| 2014 | 83.67% | 84.13% | 84.50% |
| 2015 | 87.27% | 86.77% | 87.30% |
| 2016 | 77.88% | 84.79% | 84.40% |
| 2017 | 80.37% | 85.18% | 85.20% |
| 2018 | 84.07% | 87.53% | 87.80% |
| 2019 | 77.32% | 82.47% | 82.00% |
| 2020 | 76.24% | 86.08% | 85.10% |
| 2021 | 70.29% | 83.53% | 81.80% |
| 2022 | 80.15% | 85.02% | 85.00% |
| 2023 | 73.61% | 85.62% | 84.00% |