
Overview of available and in-development PowerBI report content
Click on any of the reports below for a report overview, list of available report pages, training documents (infographic, manual, glossary), and training videos (as available).
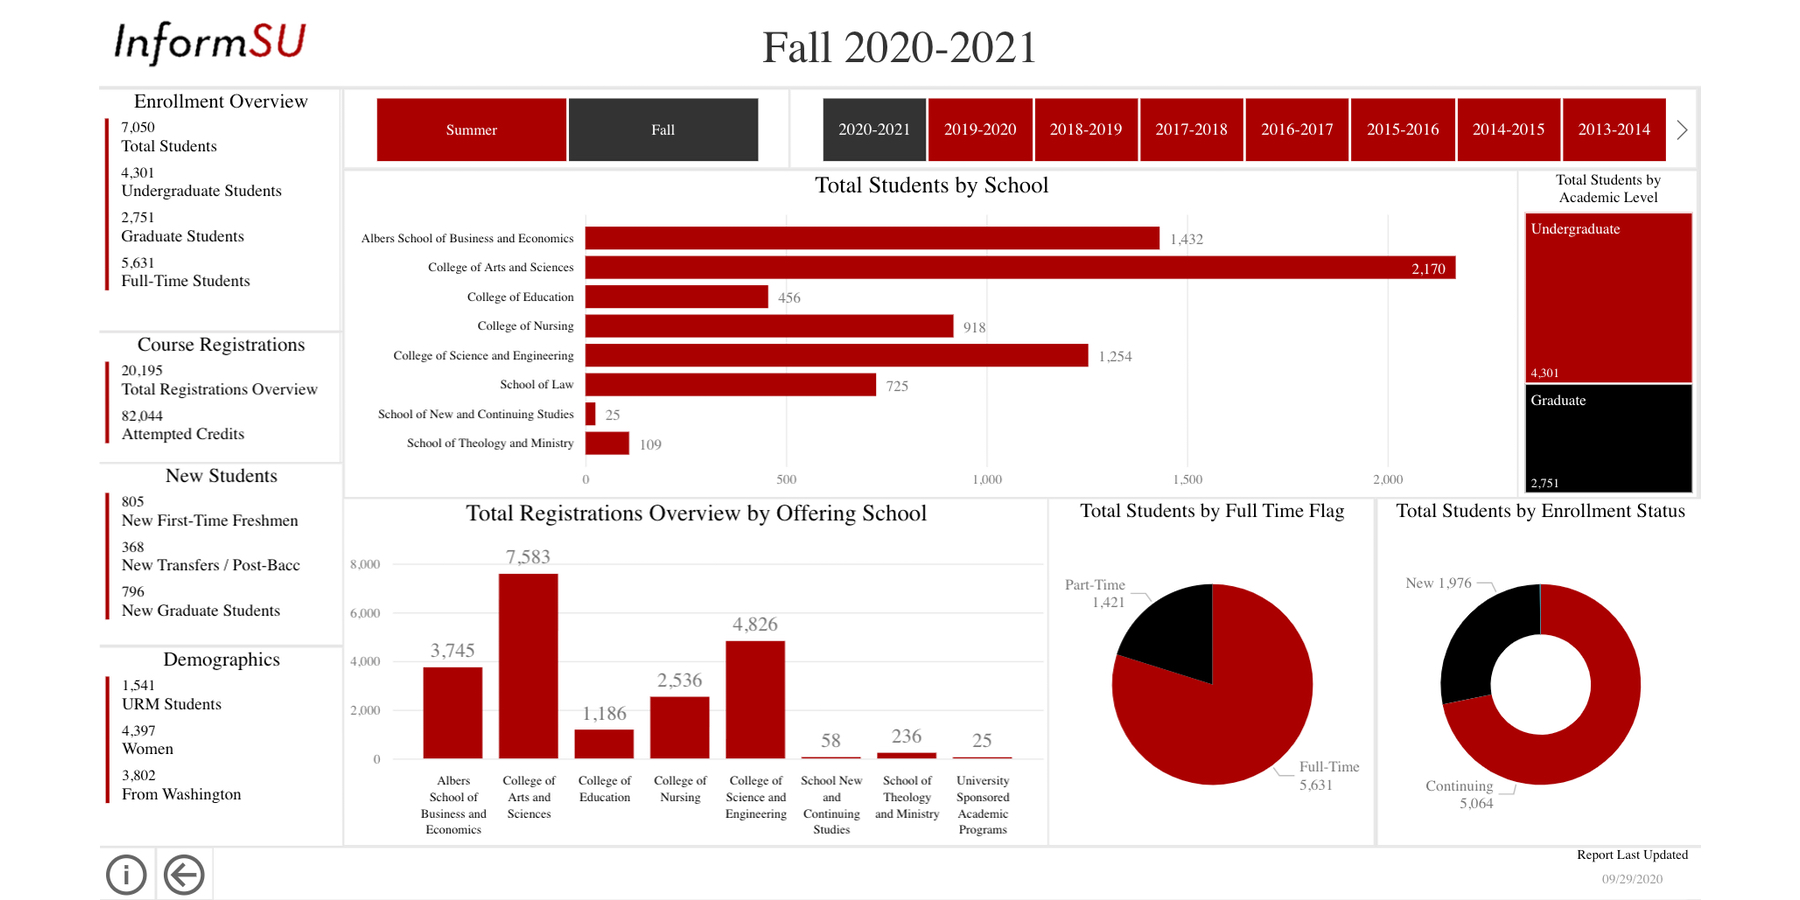
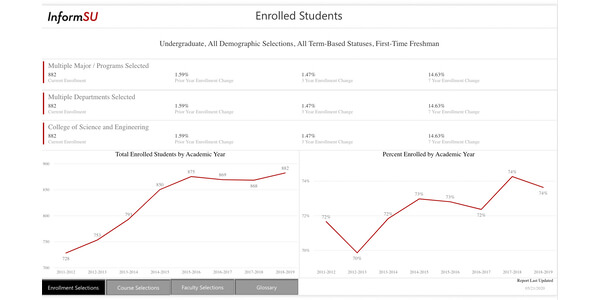
This report provides answers to questions concerning enrollment data in any quarter since AY2008-09 and provides trends over that time based in each term's enrollment, registration, and credits generated by students.
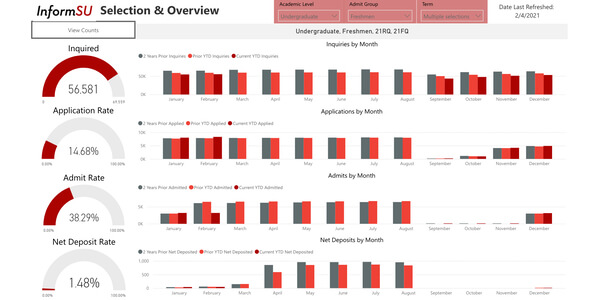
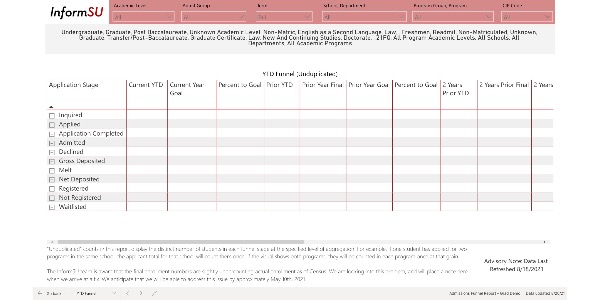
This report presents information for four upcoming terms for undergraduate and graduate students and allows for a YTD (year-to-date) comparison of counts of applicants of interest at every funnel stage, from inquiry to registration and across school/college level, department level, and program level. It also contains demographic, academic, geographic, and financial aid information for applicant populations.
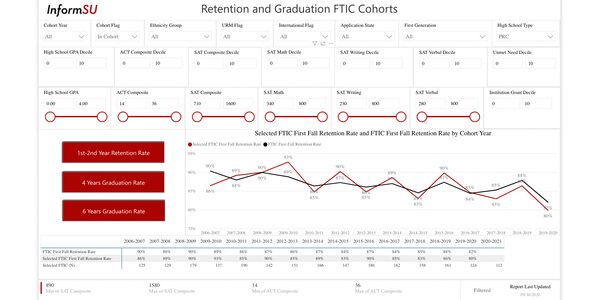
This report allows the user to assess differential rates of fall to fall retention and 4- and 6-year graduation for FTIC (first time in college-entering) students. It also contains retention information and 2- and 4-year graduation rates for TR (transfer-entering) students. Retention and graduation rates are differentiated by academic, demographic, and socioeconomic student characteristics.
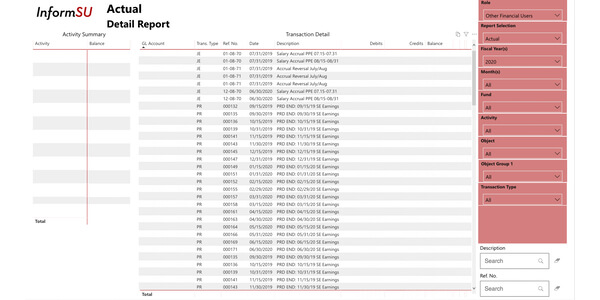
These reports contain detailed information by year and month of GL activities and by object group.
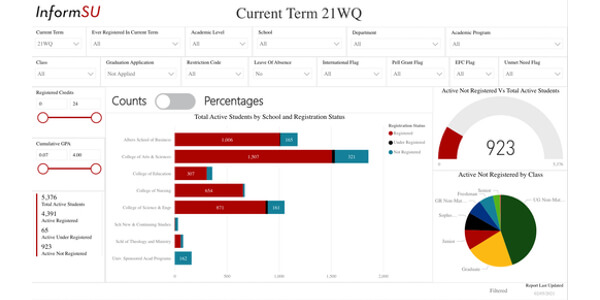
This report contains registration information about all currently active students for all currently open-for-registration terms improve retention outcomes for all students by providing means of outreach to non-registered or under-registered students.
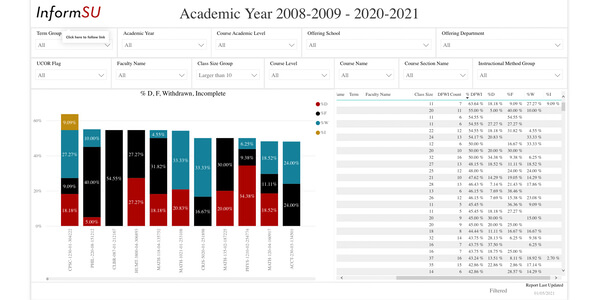
This report identifies courses where a larger than average proportion of students receive incomplete grades, withdraw, or receive D or F grades as well as other course-based information, including total class size, the total count of D/F/W/I grades, and the proportion of each of those grades separately.
This report contains data aligned with that requested in the program review guidelines document, and addresses the questions such as Demand for program, Student admissions, Retention and graduation, Program size and productivity, and Program faculty. It is likely to be deprecated soon and replaced with a more comprehensive report.
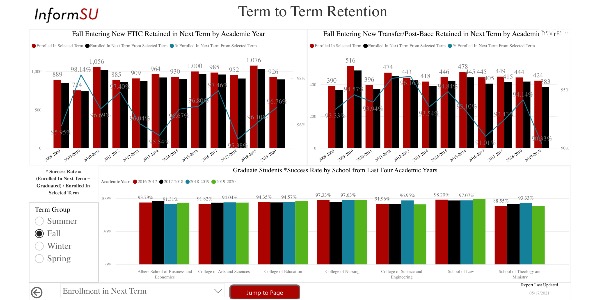
This report depicts student’s persistence by academic program from term to term. It provides two perspectives on term to term retention: proportion retained from previous term as well as the proportion of students progressed into next term. The report has three main pages: Enrollment From Previous Term, Enrollment in Next Term, and Registration Detail
This report is focused on the population of students who have applied for graduate level academic programs. The year over year framework mirrors that of the general Admissions Funnel Report, meaning that you can view current funnel figures and compare them with prior YTD (year to date), two years prior YTD, and three years prior YTD along with final funnel counts for the prior three years. One of the main differences in this report, aside from the student population filter, is the integration of graduate program registration goals.
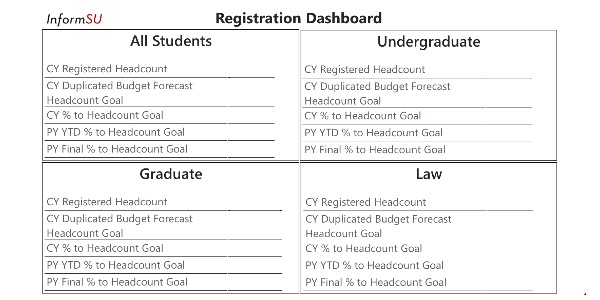
This report contains headcount and credit hour current registration information, with comparisons to budget goals as well as year-to-date (YTD) headcount and credit hour registrations for the prior year. The pages in this report provide a dashboard-level overview of registration progress as well as headcount and credit hour detail for student sub-populations.
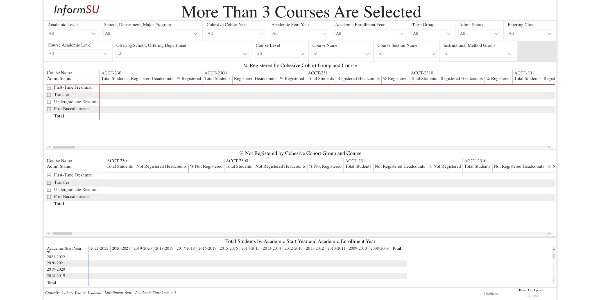
This report provides a comprehensive picture of course registration, historical enrollment patterns, and student-based course requirements to support course offering decisions. It aims to assist in the task of forecasting the needed number/type of course sections by showing the number and proportion of freshman- and transfer-entering students taking selected courses at any given time during their matriculation at Seattle University.
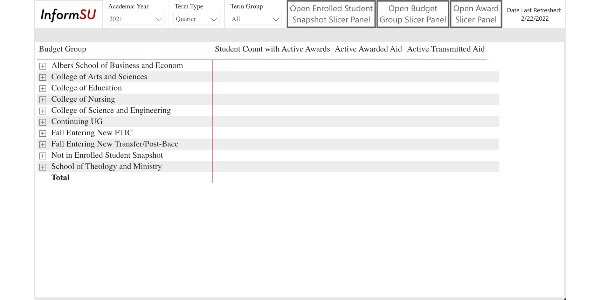
The Current and Historical Financial Aid Report allows users to view financial aid awards as they were in the past and compare historical values against active and transmitted awards. This report features a number of slicers to display award totals across a variety of different populations. The Enrolled Student Snapshot slicer panel includes things like gender, age, race, and ethnicity, all sourced from the official Enrolled Student Snapshot tables. Users can also filter by award code, type, and GL structure using the Award slicer panel.
The Payroll Reporting Suite houses 6 payroll focused reports: The Salary Distribution Report, Arrupe Salary Distribution Report, Non Exempt Student Employee Report, Non Exempt Staff Time Entry Report, Jesuit Deductions Salary Report & Jesuit Deductions Fringe Benefit Report. Each report's description can be found on the Payroll Reporting Suite page along with links and/or manuals.
For any additional questions or to request access to specific reports, click on the following box to email the InformSU team.